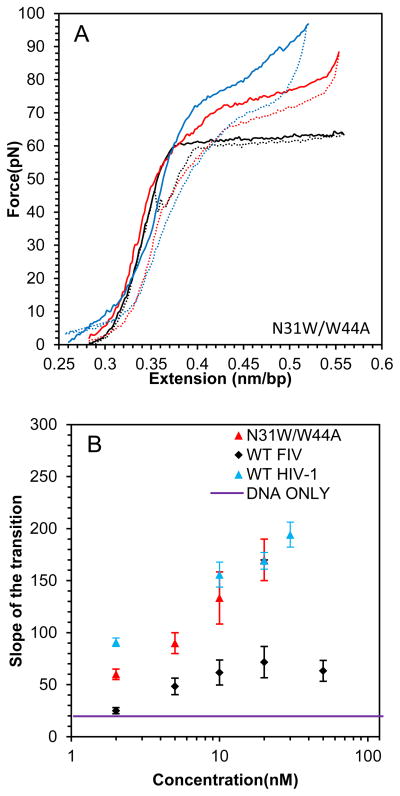
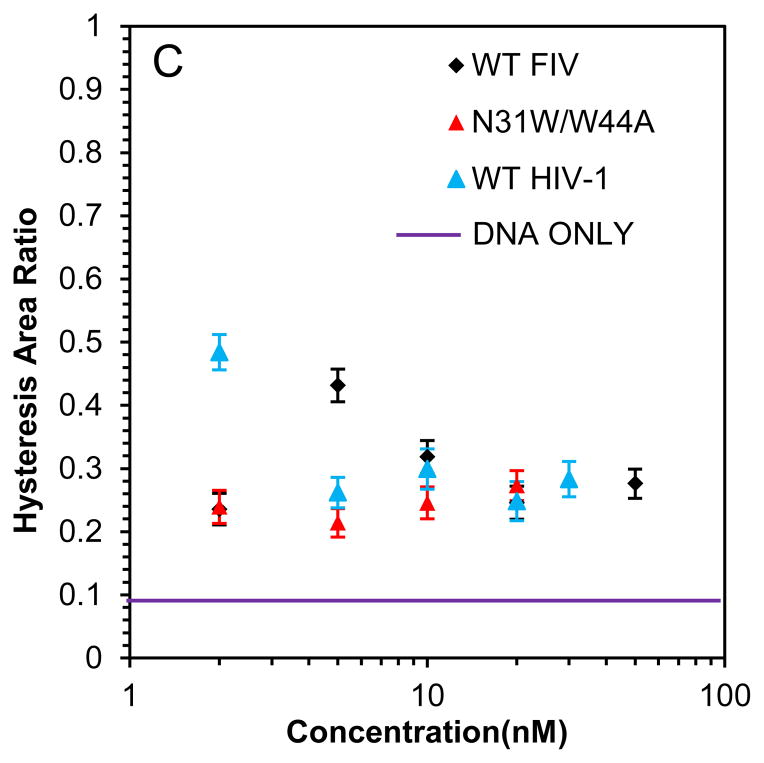
Fig. 8.
(A) DNA stretch (solid line) and release (dotted line) curves in the absence of protein (black) and in the presence of 2 nM FIV NC N31W/W44A (red) and 20 nM FIV NC N31W/W44A (blue). (B) Slope of the transition of FIV NC WT (black) and N31W/W44A (red). (C) Hysteresis versus concentration of FIV NC WT (black) and N31W/W44A (red). Error bars are propagated from the uncertainty in the force-extension measurements.


