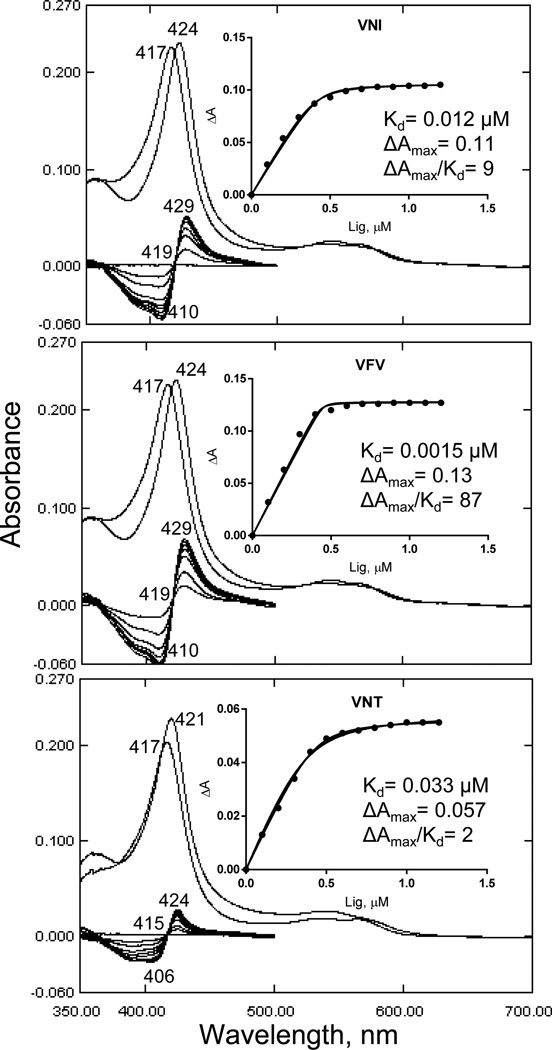
Figure 7. Spectral responses of Y-CYP51A to the binding of VNI, VFV and VNT.
[P450] = 0.4 µM. Optical path length 5 cm. Upper: absolute absorbance spectra, the Soret band maximum shifts to the right. Lower: difference spectra upon titration with the inhibitors; titration step 0.2 µM, titration range 0.1–1.3 µM. Compounds were added to the sample cuvette from 0.2 mM stock solutions in DMSO. At each step, the corresponding volume of DMSO was added to the reference cuvette. Insets: titration curves.

