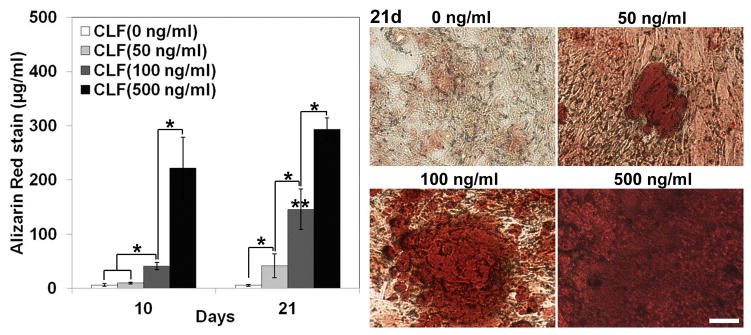
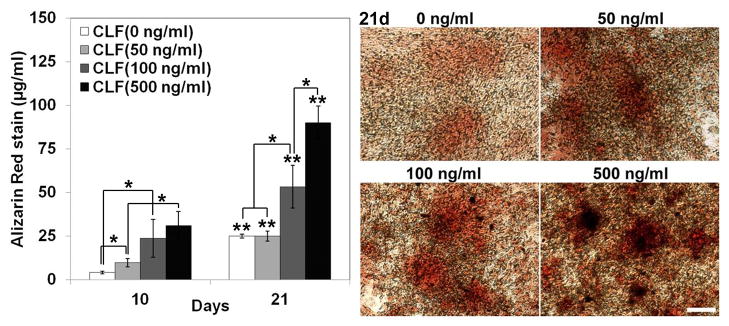
Figure 9.


Dose effect of BMP-2 released from the CLF hydrogels on calcium mineral deposition in (a) W-20-17 and (b) C2C12 cells. Different concentrations of BMP-2 (0, 50, 100, or 500 ng/ml) were loaded into the CLF hydrogels. The presence of mineral within the cell layers was stained with Alizarin Red S (AR-S) staining solution at day 10 and 21. The red color areas and nodules demonstrate AR-S positive staining for calcium mineral in the cell layers (MAG = ×10).The calcium mineral contents were also quantitatively determined from Alizarin Red S staining extracts from the cell layers at day 10 and 21. Destained Alizarin Red S concentrations were determined at the absorbance of 405 nm and expressed as μg/ml. Each value represents the mean ± SD (n = 3 per each group). Each value represents the mean ± SD (n = 3). * denotes significant difference between groups at same time point (p<0.05). ** denotes significant difference in the same group at different time point (p<0.05).
