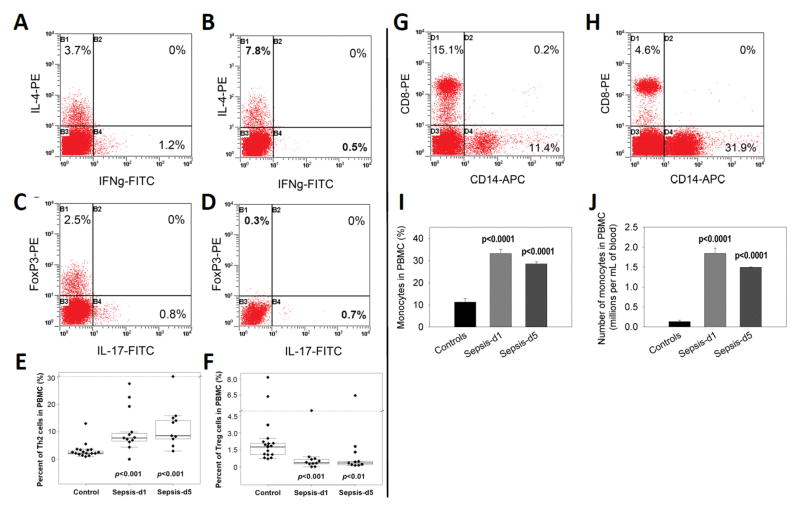
Figure 2. Th1, Th2, Th17 and Treg and monocyte populations in PBMC between controls and sepsis patients.
PBMC were isolated from human peripheral blood samples by Ficoll gradient centrifugation. They were stimulated with 50μg/mL PHA for 3 days. After staining with FITC-anti-IFN-γ, PE-anti-IL-4 or FITC-anti-IL-17, PE-anti-FoxP3 and APC-anti-CD4 antibodies, the cells were analyzed by flow cytometry. Next, the percentage and absolute numbers of Th1, Th2, Th17 and Treg cell populations, respectively, were determined. A representative profile of IFN-γ producing Th1 cells and IL-4 producing Th2 cells in PBMC from a normal control (A) and a sepsis patient at day 5 was shown (B). Also, representative profiles of IL-17 producing Th17 cells and FoxP3 positive Treg cells in PBMC from a normal control (C) and a sepsis patient at day 5 were shown (D). Percentages of Th2 (E) and Treg (F) cell populations in PBMC were compared between controls (n=38) and sepsis patients (n=32) at days 1 and 5. In panels E and F, the boxed data included 50% of measurements at medium level, the line in the box was the average value and the data beyond the upper line were the outliers. For comparison of monocytes, PBMC were stained by APC-anti-CD14 antibody, monocyte populations (CD14+) were determined by flow cytometry. A representative profile of CD14-positive monocytes in PBMC from a normal control (G) and sepsis patient at day 1 was shown (H). Percentages of CD14-positive monocytes (I) and their absolute numbers (J) in PBMC were compared between controls and sepsis patients at days 1 and 5. P values between controls and sepsis patients at days 1 and 5 are shown.

