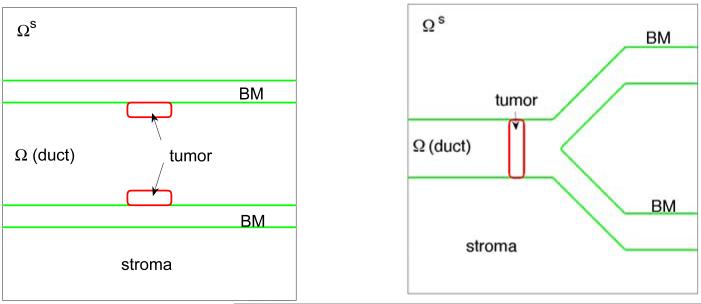
Figure 1.
The initial shape of tumor clusters (red; ϕT = 0.5 contours) and basement membranes (green; ψ = 0.5 contours) in the 2D simulations. Left: simple duct; Right: branched duct. Note that in the simple duct, the membrane thickness is explicitly modeled by introducing the inner and outer membrane boundaries.

