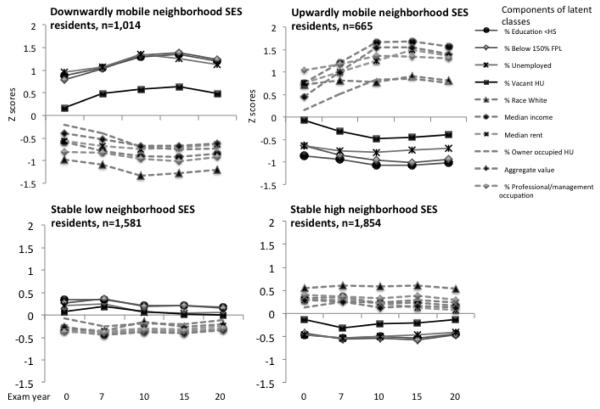
Figure 1.
Temporal changes in neighborhood SES characteristicsa, by 4 classesb of longitudinal neighborhood SES resident characteristics: the Coronary Artery Risk Development in Young Adults (CARDIA) Study, 1985-2006.
aU.S. Census-tract level data spatially and temporally linked to CARDIA exam years (Year 0, 1980; Years 7 and 10, 1990; Year and Year 20, 2000); percent of education below HS is among persons aged 16 years and over, aggregate value is among owner-occupied HU
bDerived from latent class analysis using Mplus version 7(Muthen LK and BO 2010) of Census tract-level data from exam years 0, 7, 10, 15, and 20: percent race white, percent education <HS, percent poverty (below 150% FPL), percent unemployed, percent professional/management occupation, median income, percent vacant housing, aggregate housing value, percent owner occupied, median rent. All measures were normalized to Z-scores and percent vacant housing units, aggregate housing value, percent owner occupied, median rent were normalized by center.
Abbreviations: SES: socioeconomic status, FPL: federal poverty level, HU: housing units, HS: High School.

