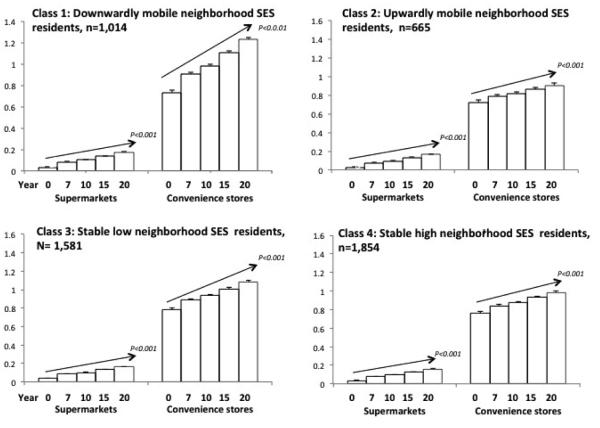
Figure 3.
Estimated meana of neighborhood supermarkets and convenience store densitiesb by 4 classesc of longitudinal neighborhood SES residents characteristics: the Coronary Artery Risk Development in Young Adults (CARDIA) Study, 1985-2006.
aDerived from latent class analysis using Mplus version 7(Muthen LK and BO 2010) of Census tract-level data from exam years 0, 7, 10, 15, and 20: percent race white, percent education <HS, percent poverty (below 150% FPL), percent unemployed, percent professional/management occupation, median income, percent vacant housing, aggregate housing value, percent owner occupied, median rent. Time trends were derived from class-specific multivariable random effects regression models that included population density wi hin tract, a random effect for each participant, and year.
bCounts of Dunn & Bradstreet food resources within Euclidean 3km buffer per 10 km local and secondary roadways.
cMultivariable random effects regressions modeling each neighborhood food resource as function of class indicators (referent is stable high neighborhood SES residents) , exam year (continuous), interaction of class indicators by exam year, population density, and a random effect for each participant.

