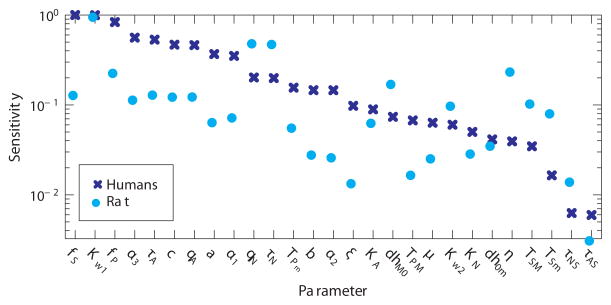
Figure 4.
Ranked sensitivities. Dark blue exes show rankings for human data obtained by averaging ranked sensitivities for the three human subjects. Cyan circles denote ranked sensitivities for the rat data. Both are scaled such that the highest sensitivity has value one. Parameters associated with sympathetic activation appear more sensitive for the rat than the humans (qN, τN, dhM0, η, TSM, TSm), while other parameters appear to be ranked similarly. Parameters τNS and τAS were insensitive for all datasets, and thus kept at their a priori values.

