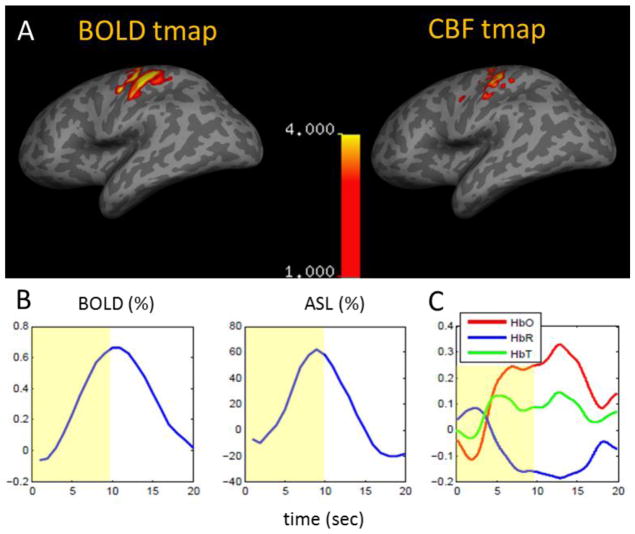
Figure 1.
Multimodal recordings of BOLD, ASL and DOT for a typical subject. A) Activation maps (p<0.05) for BOLD and CBF respectively. B) BOLD and CBF responses averaged over its respective statistically significant voxels. C) HbO (red), HbR (blue) and HbT (green) (μM) responses from simultaneous DOT recordings.

