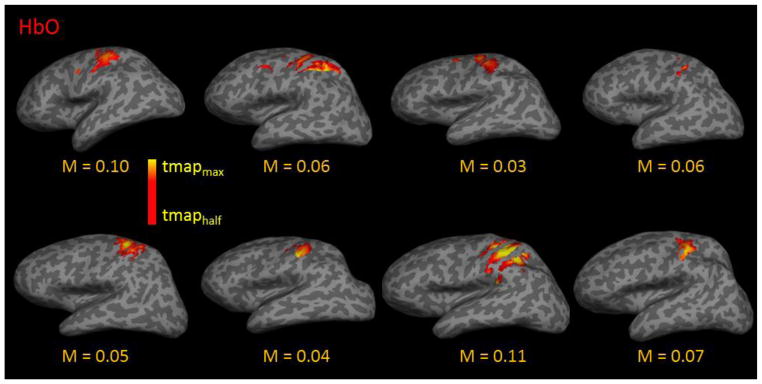
Figure 2.

Output of the DOT-BOLD-ASL multimodal fusion model. HbO t-maps (p<0.05) are shown for each subject (n=8). Activation was reconstructed over the motor and somatosensory regions. The fusion model also simultaneously estimate the BOLD calibration constant M, which is given for each subject.
