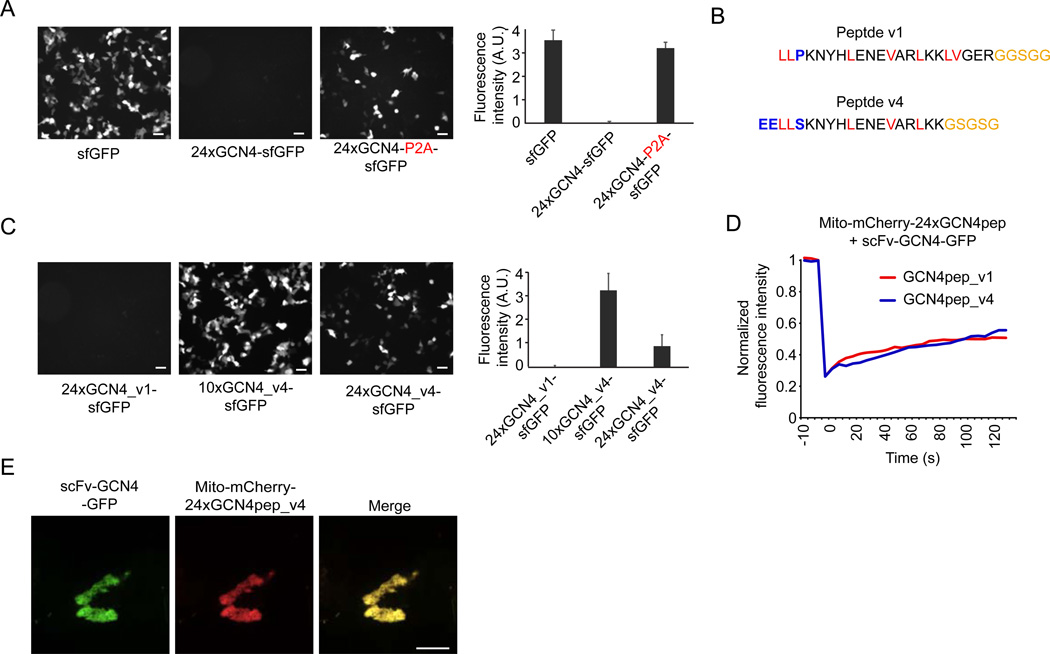
Figure 4. An optimized peptide array for high expression.
(A) Indicated constructs were transfected in HEK293 cells and imaged 24 hr after transfection using wide-field microscopy. All images were acquired using identical acquisition parameters. Representative images are shown (left) and fluorescence intensities were quantified (n=3) (right). (B) Sequence of the first and second generation GCN4 peptide (modified or added residues are colored blue, hydrophobic residues are red and linker residues are yellow). (C–E) Indicated constructs were transfected in HEK293 cells and imaged 24 hr after transfection using widefield (C) or spinning disk confocal (D–E) microscopy. (C) Representative images are shown (left) and fluorescence intensities were quantified (n=3) (right). (D–E) GFP signal on mitochondria was photobleached and fluorescence recovery was determined over time. The graph (E) represents an average of 6 cells per condition. (E) shows an image of a representative cell before photobleaching. Scale bars in (A,C), 50 µm, scale bars in (D,E), 10 µm. See also Movie S7.

