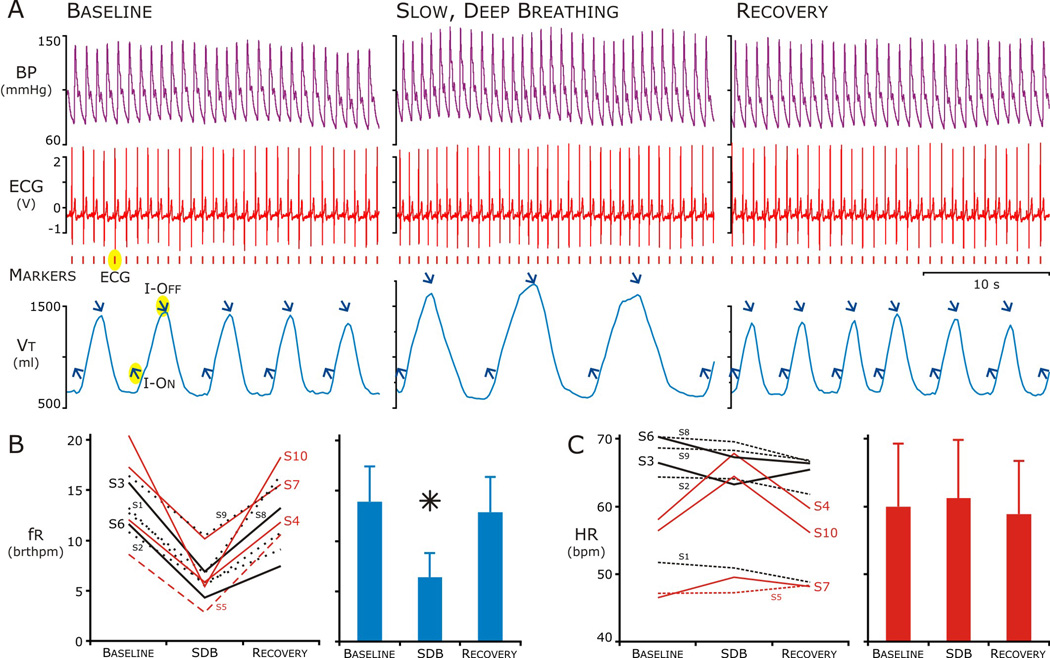
Figure 1. The heart rate (HR) response to slow, deep breathing varied among subjects.
A. Representative tracings at baseline, during, and after Slow, Deep Breathing. Traces during each period from top: blood pressure (purple) ECG (red) and Thoracic-Abdominal volume (blue). Markers; Peak of the R-wave in ECG (red) and onset of inspiration and peak of breath (upward and downward blue arrows respectively).
B. During slow, deep breathing, respiratory frequency (fr) decreased well below ten breaths per minute (20 bthmpm) in all but 2 subjects (S7 and S9, left panel) and this decrease was significant for the group (Right Panel). In the 20-min epoch after SDB (Recovery), fr returned to baseline.
C. Heart Rate (HR) did not change for the group across the epochs (right panel), but HR increased in 3 of 10 subjects (S4, S7, S10) during and in another (S5) after SDB (left panel, red lines).

