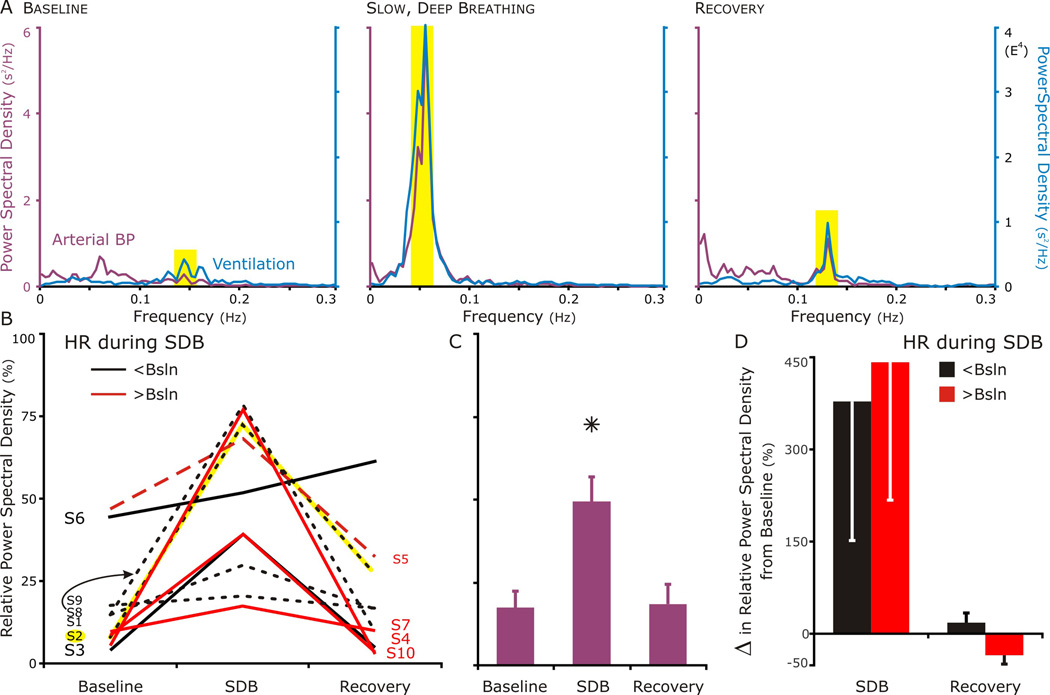
Figure 2. Power Spectral Density (PSD) of respiration and blood pressure between 0.005 and 0.30 Hz; at baseline, during, and after slow, deep breathing.
A. A set of PSD graphs representing the result consistent with our hypothesis. The respiratory PSD (blue line) identified the band width for the high-frequency component of cardiovascular PSD (purple line), because it depended on respiratory-modulated vagal nerve activity. The PSD of blood pressure had a small but evident component during relaxed breathing at baseline (left panel); robust, during slow, deep breathing (middle panel); and moderate during recovery (right panel). In this particular subject (S2), in comparing before and after slow deep breathing, the strongest component of the PSD for blood pressure shifted from a low frequency that was independent of respiration to a high frequency that corresponded to respiration.
B. In 9 of 10 subjects, the percent of the total power in the BP PSD that overlapped with the respiratory PSD was highest during SDB (S2, depicted in A highlighted in yellow). The one exception (S6) had a large respiratory-modulated component at baseline, which increased during SDB and continued to increase during recovery.
C. The relative BP-PSD increased for the group during SDB, but returned to baseline in recovery.
D. Separating those subjects that decreased their HR during SDB (black-filled bars) from those that increased it (red-filled bars), revealed a possible effect of SDB on the BP-PSD during recovery may depend on the change in HR during SDB. All 3 of the subjects who increased their HR during SDB had a lower high frequency component in their relative PSD even though they responded well during SDB. The subject that had increase in HR during recovery (S5) also had a lower high frequency component following SDB.

