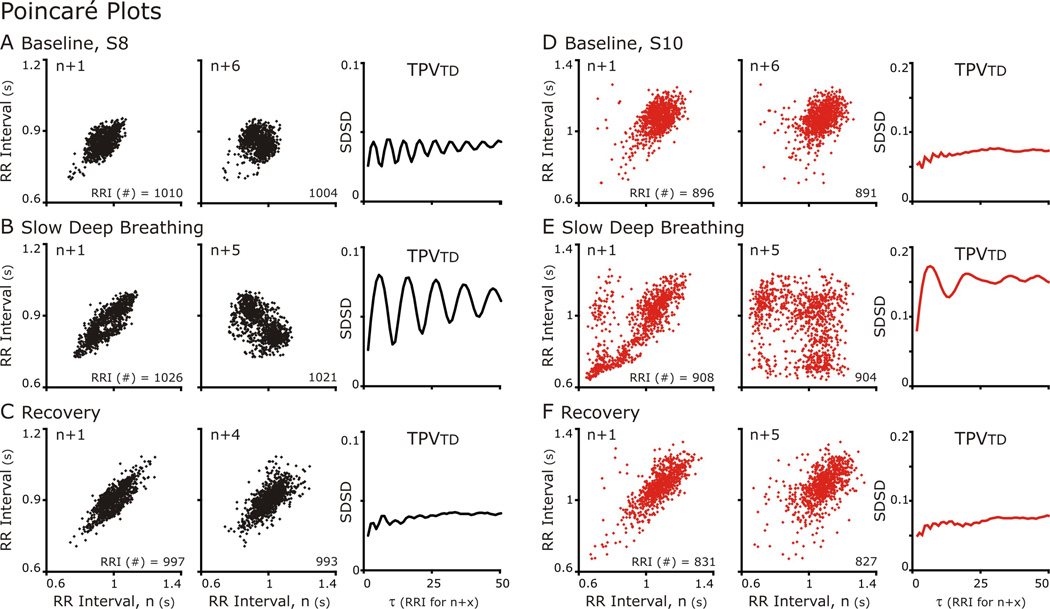
Figure 4. Poincaré Plots of RR Intervals either n+1 (Left Column) or n+5 (Center Column) and TPVtd calculated for 50 Poincare plots plotted against n.
A&D. At baseline for both subjects, n+1 versus n Poincare plots formed an elliptical cloud of points, and n+5 vs n plot had a more circular shape. These shapes are indicative indicative a normal HRV. The n+5 was plotted because the TPVtd plot showed an oscillation in which the nadir of SDSD occurred at 5.
B&C. During SDB. The TPVtd revealed that both subjects had strong RSA with S8 greater than S10. In S8 the n+1 vs n plot had a small void on the line of identity in the center of the ellipse, which is near the mean HR. In the n+5 vs n graph represent the largest SDSD and the distribution forms two clouds. S10 reveals a more complex especially in the n+5 vs n Poincaré plot. C&E. Distribution patterns returned to baseline.

