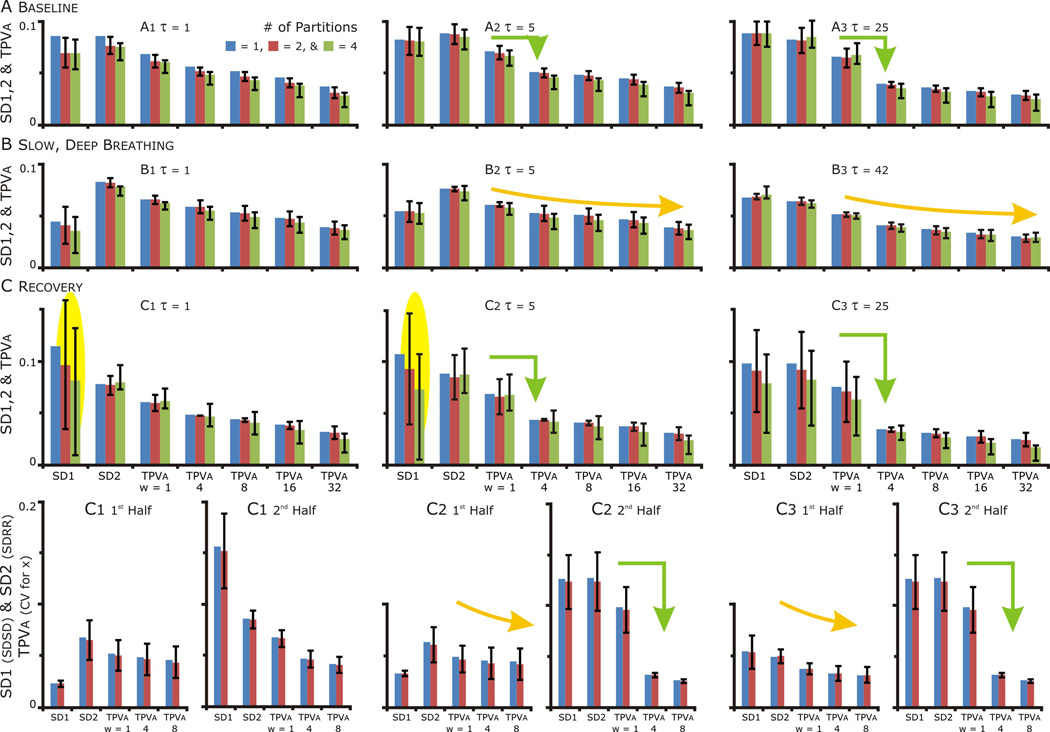
Figure 7. SD1, SD2 and TPVa at τ=1, 5 and ≥25 for the whole and partitioned data set. The variance of SD1 during recovery in the partitioned data set indicative of a nonstationarity in the data. The nonstationarity related to a persistent effect of SDB resolving, and then aggravating bigemney in HR.
A, B & C. Blue bars: the values of SD1, SD2 and TPVa for the whole data set, Red bars: median + 25th and 75th percentile values with the data set partitioned in half. Green bars: values with the data set partitioned in quarters. SD1 = the standard deviation of successive difference (SDSD) and SD2 = the standard deviation of the RR Intervals (SDRR). The Temporal Poincaré Variability for averaged points or TPVa = the coefficient of variation for x, which the distance of the points from the origin. On the x-axis, w = the number of points that were averaged. As w increased, TPVa decreased as averaging reduced the variability caused by beat to beat variability (compare w=1(no averaging) to w>1).
C. In the recovery period, the variability in SD1 indicated a nonstationarity in the data set (yellow oval highlight). The source of this variability was resolved with separate analysis of each half of the recovery data set, the SD1 values for the 1st&2nd halves were an order of magnitude different.
A, B & C. Comparing TPVa: In B: TPVa decreased progressively as the number of points averaged increased (yellow curved arrow) reflecting the the distribution points becoming more circular (as in yellow highlighted regions in Fig. 6). In contrast in A&C: TPVa decreased abruptly with averaging (green arrow) reflecting the clustering of points as τ increased.

