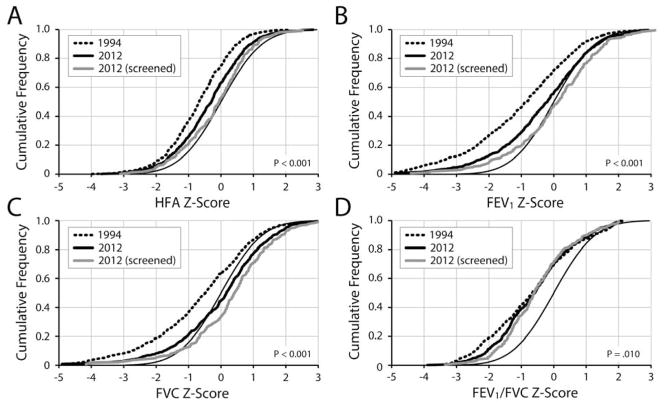
Figure 2.
Cumulative frequencies of HFA, FVC, FEV1, and FEV1/FVC Z-Scores in 1994 and 2012. Plots show the proportions of children (Y axis) with Z-scores less than or equal to a given value (X axis). P values are for two-sample Kolmogorov-Smirnov tests for differences between 1994 and 2012 distributions.

