Figure 5.
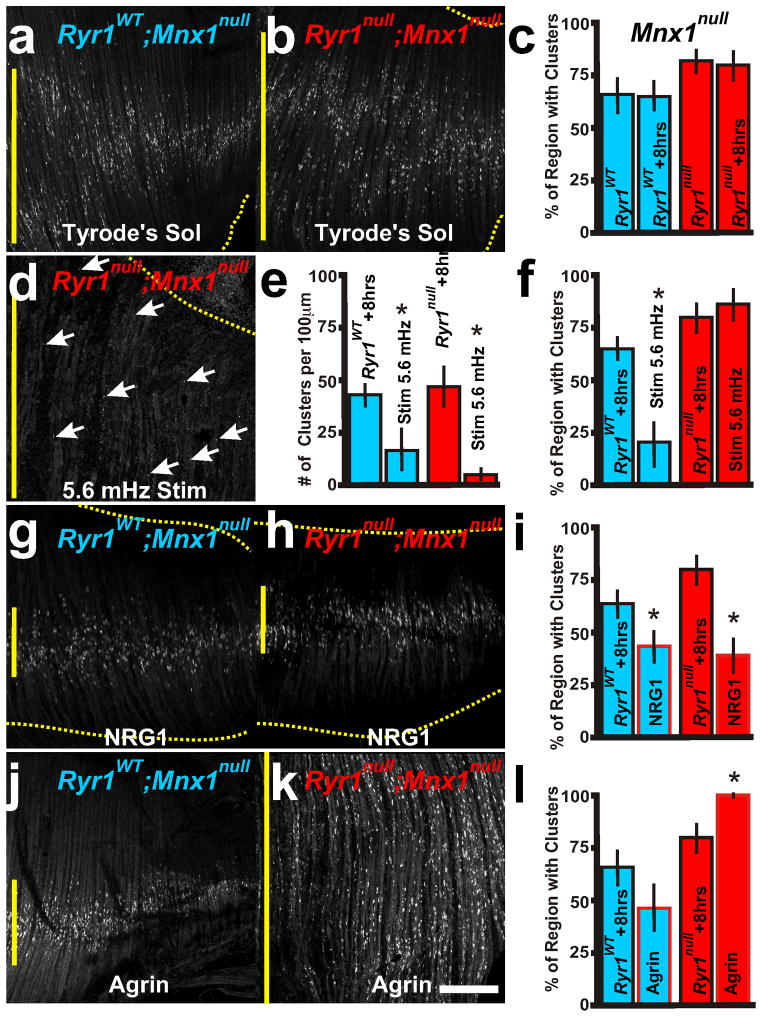
Extrinsic factors that affect redistribution of AChR clusters. Representative examples of E15.5 RyR1WT; Mnx1null (a, g, j, blue lettering and boxes in graphs) and RyR1null; Mnx1null (b, d, h, k, red) diaphragm AChR clusters (α-bungarotoxin) after explant culture. c, f, i, l, Quantification of regionalization in various 8 hour explant treatments. d–f, RyR1null; Mnx1null explant that was stimulated every 3 minutes for 8hr (5.6 mHz) does not centralize AChR clusters (white arrows, red box in e compared to RyR1WT; Mnx1null, blue box) and there are fewer AChR clusters (f). g–i, Neuregulin (NRG1) treated explant cultures (red outlined boxes in i) show narrowing of AChR clusters in both genetic samples. j–l, Agrin treatment (red outlined boxes in l) increases AChR cluster formation and distribution in RyR1null; Mnx1null (k, l) explants yet does not increase AChR formation in RyR1WT Mnx1null (j, l) explants. Asterisks show significance (p<0.05) of samples compared to explant controls of RyR1WT and RyR1null. Scale bar = 200 μm; yellow vertical line represents the largest width of the AChR cluster region within ventral quadrant of diaphragm shown. Each condition was performed in 5 diaphragms.

