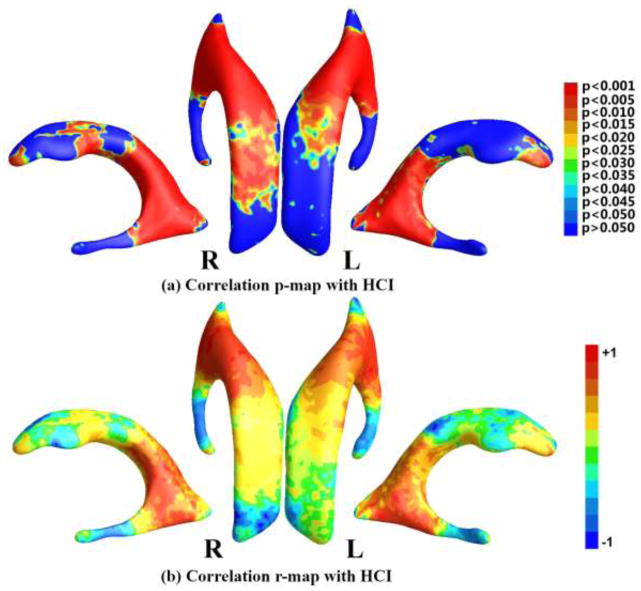
Figure 8.
Correlation maps with HCI. (a) shows the p-map of correlation results with HCI, where the non-blue color areas denote the statistically significant difference areas; (b) shows the r-map of the r-values where the red color denotes a positive correlation and the blue color a negative correlation.

