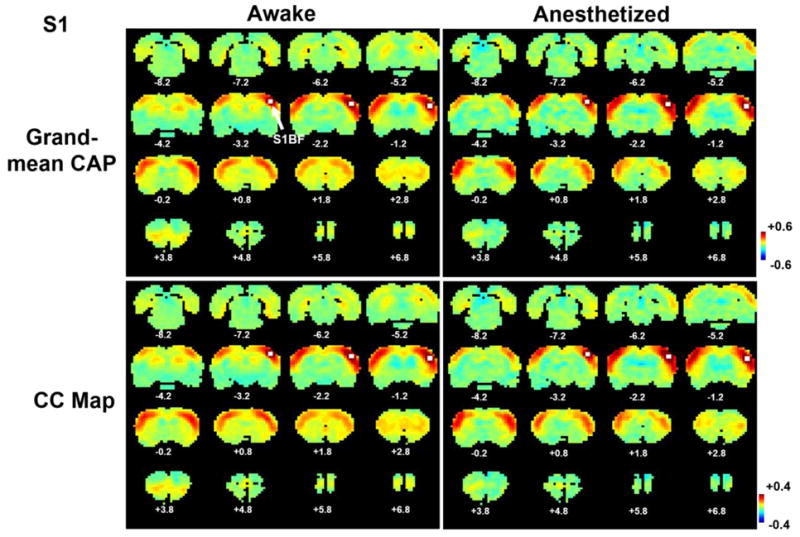
Figure 2.

Averages of 15% rsfMRI frames closely resembled RSFC maps obtained by correlational analysis for the seed of S1BF. a) Grand mean co-activation map in the awake state; b) grand mean co-activation map in the anesthetized state; c) seed correlation map in the awake state; d) seed correlation map in the anesthetized state. Distance to Bregma is marked at the bottom of each slice. The seed region of S1BF is labelled in white. Color bars in standard deviation (SD) in a and b, or in correlation coefficient in c and d.
