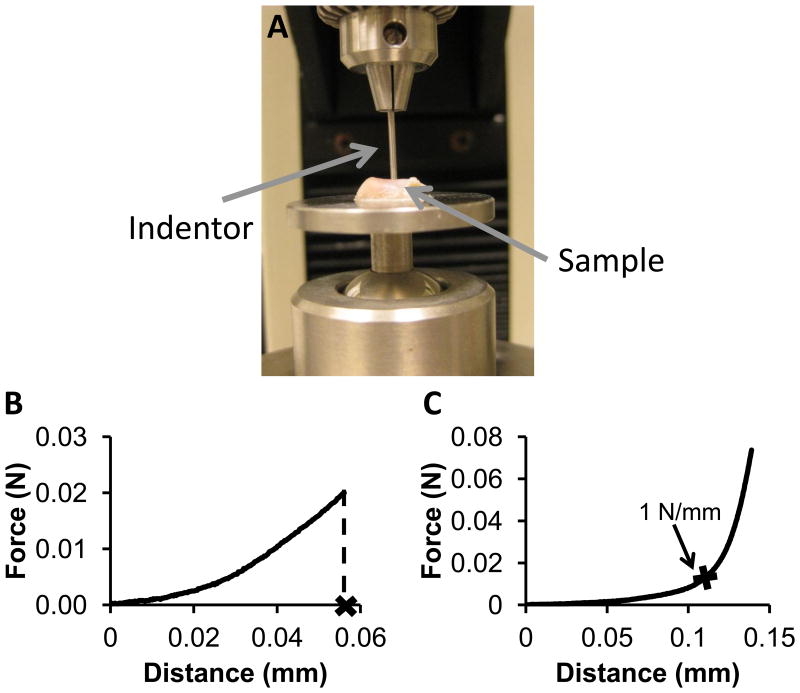
Figure 3.
Compression testing to a particular force. A) Whole condyles were glued to a rotating stage allowing for multiple testing locations. The indentor was 1 mm in diameter. Samples were kept hydrated with PBS between testing steps. B&C) Condylar fibrocartilage loading curves. B) Representative loading curve to 0.02 N for compression testing of the condylar fibrocartilage, where the distance is used as displacement for strain. C) Representative loading curve for the thickness test of the condylar fibrocartilage. The thickness was the distance in the region where the slope rapidly changed, at the point where the slope was equal to 1 N/mm.

