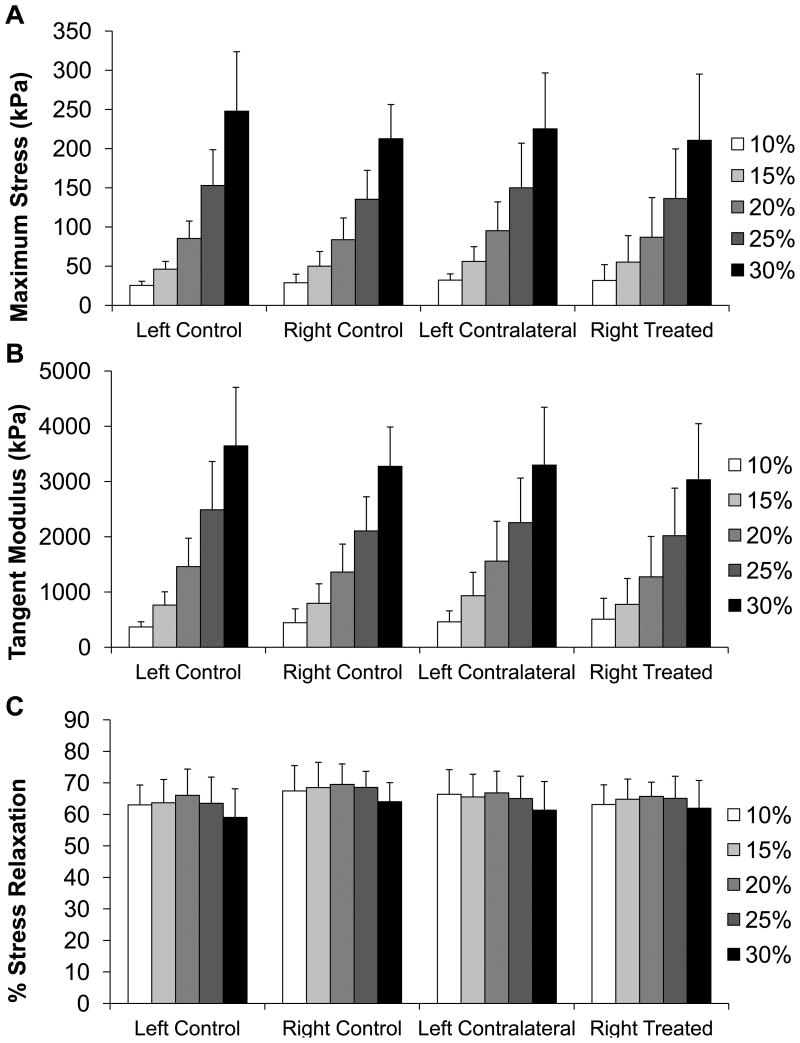
Figure 4.
TMJ disc unconfined compression results. A) Maximum stress for each strain step of unconfined compression for each TMJ disc tested. No statistical differences were seen between groups at any strain level. B) Tangent modulus for each strain step in unconfined compression for each TMJ disc tested. No statistical differences were seen between groups at any strain level. C) Percent stress relaxation for each strain step in unconfined compression for each TMJ disc tested. No statistical differences were seen between groups at any strain level. Sample size of n=8 per group. All error bars are standard deviations.

