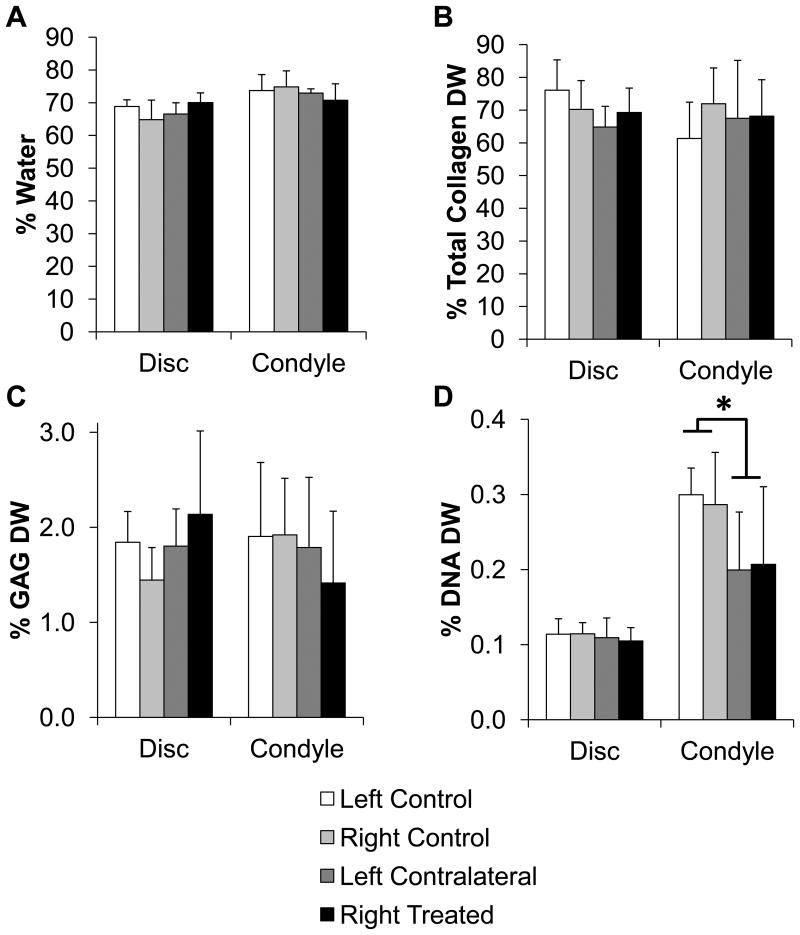
Figure 5.
Biochemical composition for the TMJ disc and condylar fibrocartilage. A) Water content, B) Total collagen content per dry weight, C) GAG content per dry weight, D) DNA content per dry weight. The only statistical difference was in the condylar fibrocartilage DNA content with the average of the splinted condyles being less than the average of the control condyles (p<0.05). Sample size of n=8 per group. Data shown as average ± standard deviation.

