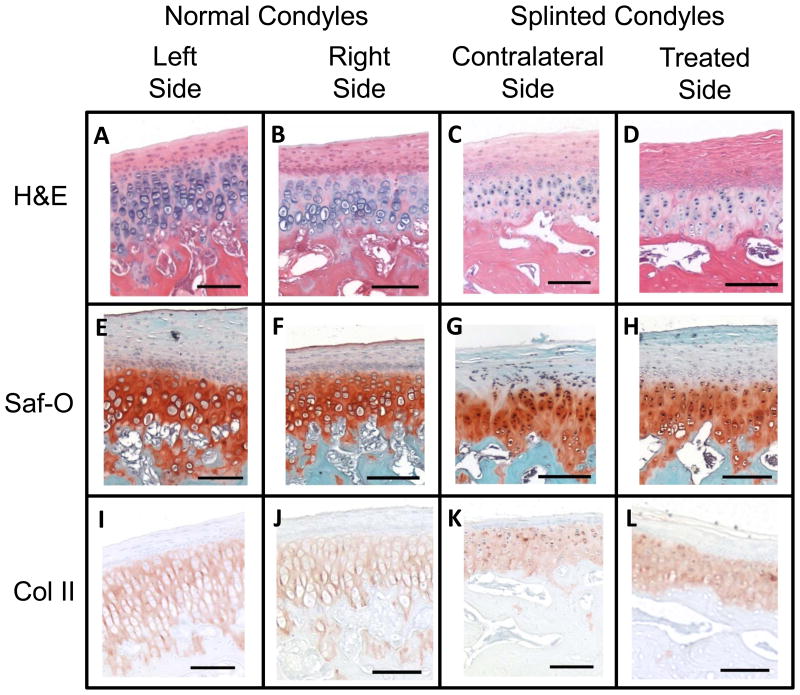
Figure 8.
Histology showing the anterior regions of the TMJ condyles at 10X magnification (scale bars = 100 μm). Boxes showing the location of each image were in Figure 7 on the left of each figure. Staining used for comparison included H&E, Saf-O for GAG staining, and Collagen Type 2 immunostain. The right and left condyles of control animals were compared to the left (contralateral) and right (treated) condyles of splinted animals. Representative pictures shown from at least n=3.

