
Fig. 2.
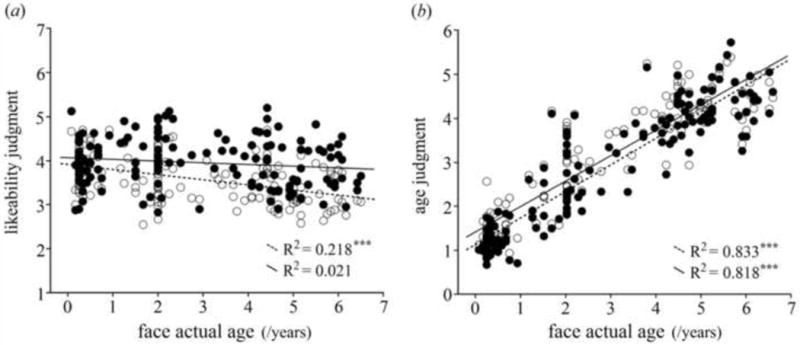
Scatter plots and regression of (a) likeability and (b) age judgments as a function of the actual ages of faces presented. Participants with siblings are represented by filled dots and a solid line with its regression value, while those without siblings are represented by unfilled dots and a dotted line. ***p < 0.001.