
Figure 3.
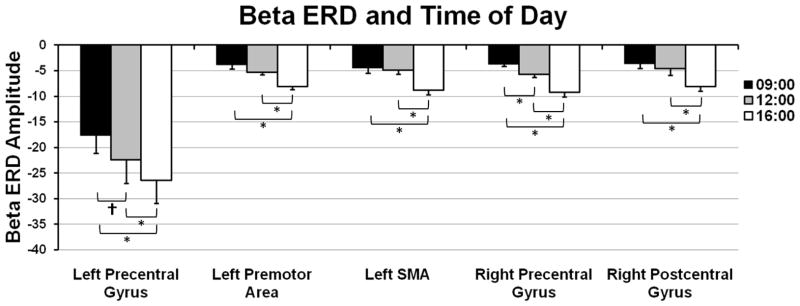
The amplitude of the pre-movement beta ERD increased from 09:00 to 16:00 and from 12:00 to 16:00 in five sensorimotor brain regions. Data are shown in pseudo-t units (y-axis) and correspond to the group mean value of the maximum difference voxel (16:00 > 09:00), which was computed using the beta ERD amplitude for this voxel taken from each participant per MEG session. A significant linear increase in beta ERD amplitude was observed across time in each brain region (p < 0.05). Error bars indicate one standard error of the mean and significant differences based on pairwise comparisons have been marked (* = p < 0.05; † = p < 0.10).