
Figure 4.
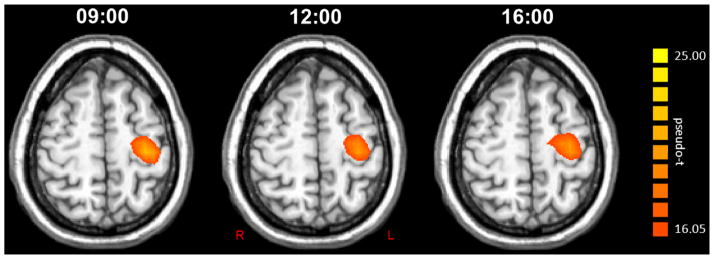
Group mean beamformer images (pseudo-t) of the post-movement beta rebound (PMBR) at each time point. The group average for the 09:00 session is shown to the left, the 12:00 session in the middle, and the 16:00 session on the right next to the color scale bar. Each image is the average of 12 images, as all four participants completed a MEG session at each time point for three consecutive days. As can be discerned, the amplitude of the PMBR was very stable across all time points in the left precentral gyrus. Images are shown in radiological convention.