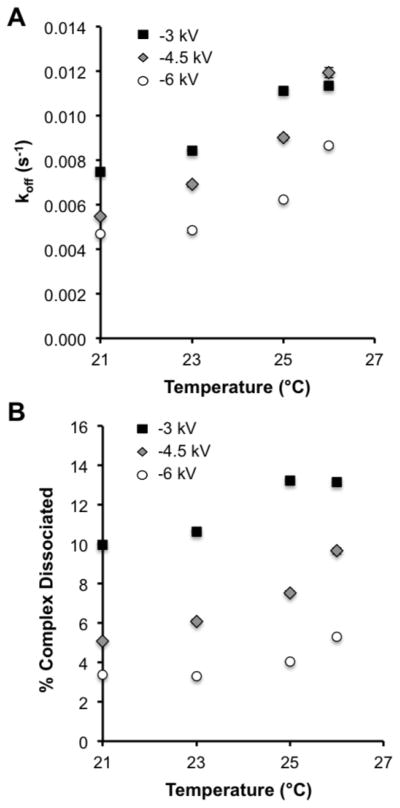
Figure 4. Kinetic effects of separation temperature and voltage.
(A) The dissociation rate constant (koff) was determined as described in [12] at the temperatures and voltages shown. The data for −3 kV is shown as the black filled squares (■), for −4.5 kV as grey filled diamonds with a black outline (
 ) and for −6 kV as white filled circles with a black outline (○). (B) The percent complex dissociated was determined as described in [15]. The symbols are the same as used in part (A).

