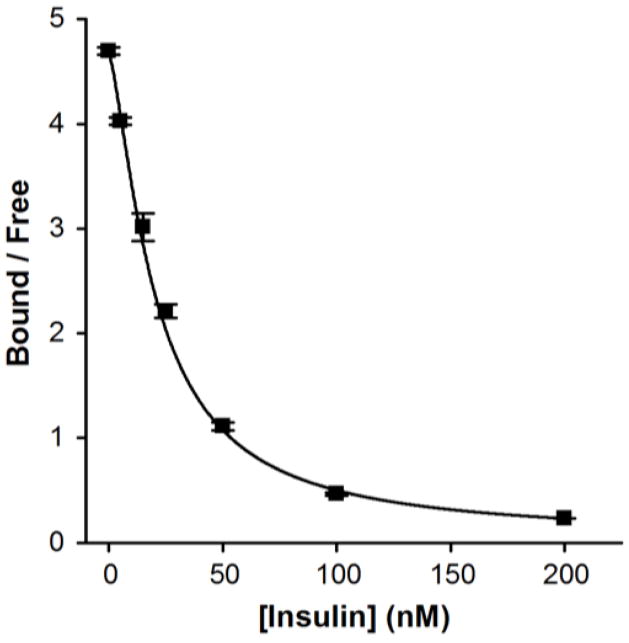
Figure 5. Calibration plot of an insulin immunoassay performed at 21 °C and 6 kV.
Bound and free were determined by the areas of the respective peaks. Each point contains an average of 5 runs and error bars represent +/− 1 standard deviation. The data was fit with a four parameter logistic fit (black line) and a 1 nM LOD was calculated.

