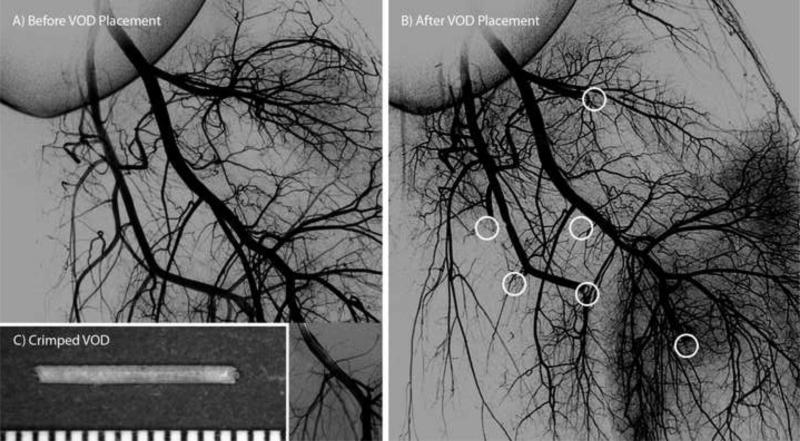
Figure 15.
Angiograms acquired (A) before implantation of the SMP foam VODs and (B) after vessel occlusion occurred. A separate angiogram showing the distal portion of one of the treated vessels is overlaid in (A). White circles indicate the locations of the SMP foam VODs in (B). (C) Compressed vascular occlusion device (scale divisions in mm).

