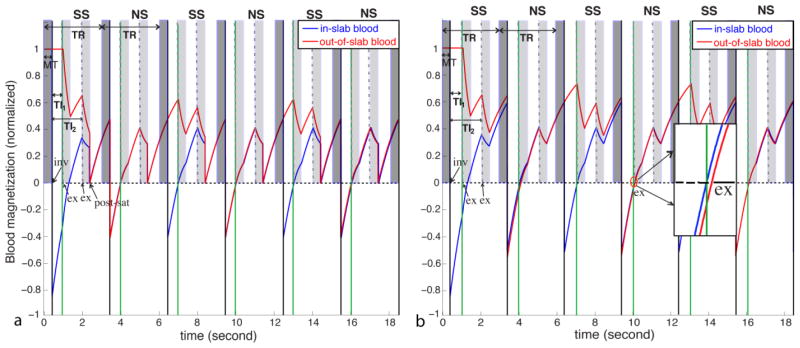
Figure 2.
Bloch simulations of the signal evolution for blood in (blue) and outside (red) the inversion slab applied in the slice-selective (SS) scan with (a) and without (b) the post-saturation module. The solid vertical black lines indicate the inversion pulses (labeled as “inv”) in the interleaving slice-selective (SS) and non-selective (NS) scans. The short dashed vertical lines represent the first excitation pulses (labeled as “ex”) in each image acquisition module, the durations of which are labeled in light shade. The MT period before the inversion pulse is labeled in dark shade. Steady state blood nulling time for VASO is marked as TI1 (solid vertical green lines) and the post-labeling delay for FAIR as TI2. (a) With the post-saturation module (labeled as “post-sat”) applied immediately after the second readout, a steady state is built after the first TR, at which both blood in and outside the SS inversion slab is nulled at TI1 in the NS scan. (b) When the post-saturation module is not applied, it takes three TRs for both in-slab and out-of-slab blood to reach steady state (for the experimental parameters used) and the out-of-slab blood is not properly nulled even at steady state (zoomed inlet).

