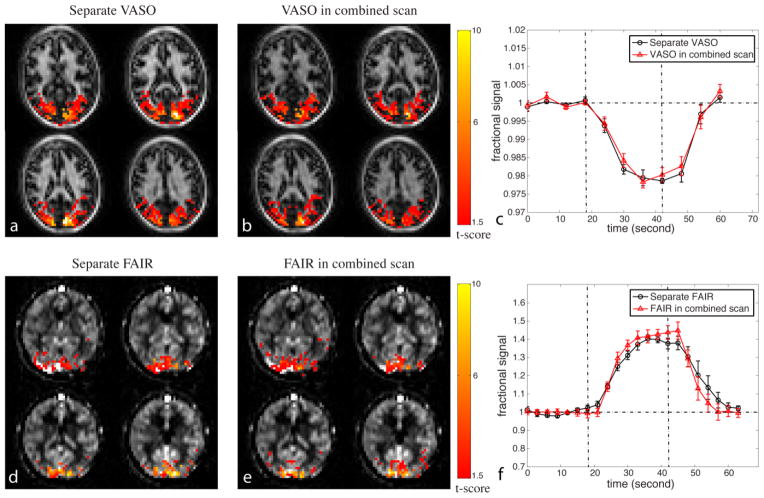
Figure 4.
Comparison of functional MRI results between the combined and separate scans. Representative activation maps from one subject for (a) separate VASO scan, (b) VASO in the combined 3D VASO-FAIR method; (d) separate FAIR ASL scan, and (e) FAIR ASL in the 3D VASO-FAIR scan are shown. The activated voxels are highlighted with their t-scores. Time courses averaged over common voxels activated in both separate (black circle) and combined (red triangle) scans (averaged over subjects, n = 6) for VASO and FAIR are shown in (c) and (f), respectively. Error bars represent inter-subject variations. The vertical dotted lines indicate the start and end of visual stimulation. Four blocks of baseline and stimulation periods were averaged to one block.

