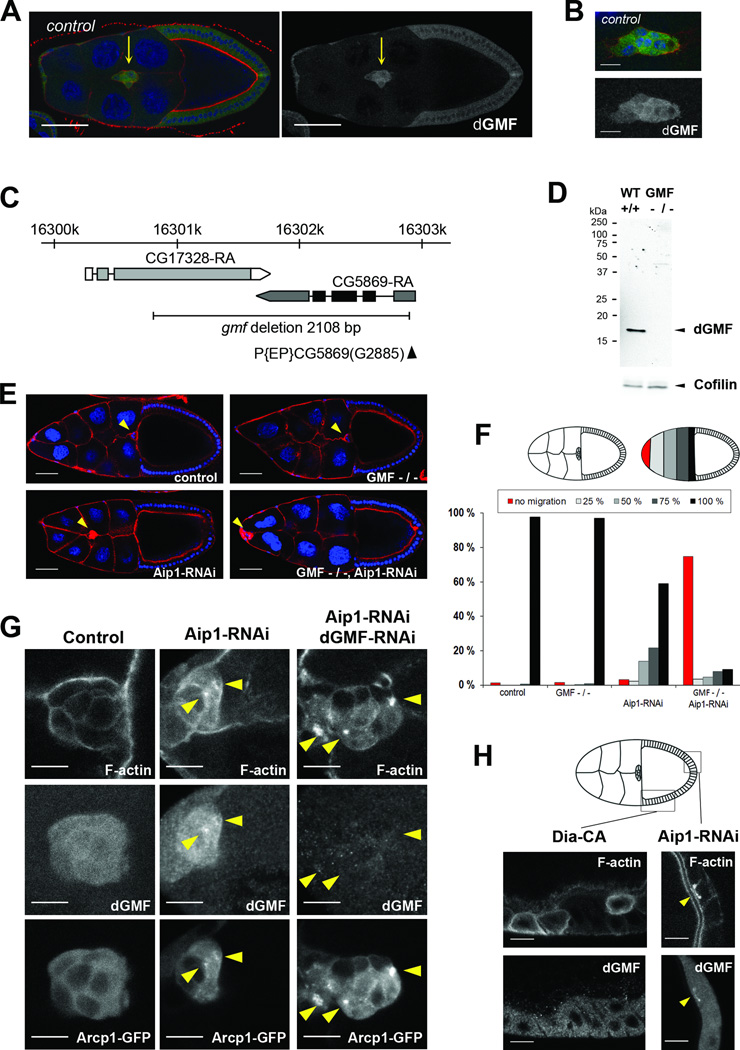
Figure 2. dGMF is expressed in migrating border cells and displays genetic interaction with Aip1 to drive border cell migration and disassembly of Arp2/3-nucleated dendritic F-actin networks.
(A) A dGMF-specific antibody demonstrates expression of dGMF in migrating border cells. dGMF is shown in green, DAPI (blue) labels DNA and phalloidin (red) labels F-actin in left panel. Only the dGMF channel is shown in the right panel. Border cells (indicated by arrow) display elevated dGMF expression compared to follicular epithelium. Bar, 50 µm. For this and subsequent figures, anterior is on the left. (B) In migrating border cells, dGMF displays predominantly diffuse cytoplasmic localization. Bar, 10 µm. Genotype for A and B is W1118. (C) Schematic diagram of dGMF (cg5869) chromosomal locus showing the dGMF transcript. P element insertion p(EP)cg5869(G2885) is indicated by black arrowhead. dGMF mutant was generated by imprecise excision and the black line indicates the 2108 bp region deleted in GMF mutant. (D) Western blot analysis of control (W1118) and homozygous dGMF mutant flies using anti-dGMF antibodies. Cofilin was used as a loading control. (E) Representative images of stage 10 egg chambers. Nuclei are in blue and F-actin in red. Yellow arrowheads indicate border cell clusters. Scale bar = 50 µm. (F) Quantification of border cell migration delays in stage 10. Upper panel, left hand side: schematic presentation of control border cells that have finished their migration to the oocyte. Right hand side: Principles of scoring the position of border cells as a percentage of their migration path to the oocyte: border cell clusters that did not delaminate or migrate (red), that migrated 25% (light grey), 50% (grey), 75% (dark grey), and finished their posterior migration to the oocyte (black). Lower panel, quantitation of the positions of border cell clusters in stage 10 egg chambers. While wild-type and GMF mutant border cells finish their migration in stage 10, Aip1 silencing causes moderate migration delays and accumulation of F-actin. These abnormalities are strongly enhanced by combining Aip1 silencing and the gmf1 mutant. N = 87 – 207. (G) Accumulation of Arp2/3-enriched F-actin aggregates (yellow arrowheads) in Aip1 and GMF silenced cells. Aip1 silencing led to formation of small F-actin aggregates in border cells, and >70 % of the foci displayed clear accumulation of Arp2/3 and dGMF. Simultaneous silencing of Aip1 and dGMF caused increased intensity and size of F-actin aggregates, virtually all of which were strongly enriched in Arp2/3. F-actin is labelled with Phalloidin, endogenous dGMF stained with an antibody and Arp2/3 visualized by Arpc1-GFP fusion. Bar, 10 µm. Genotypes for F and G were: c306Gal4/+ (control), c306Gal4/+; gmf1/gmf1 (dGMF −/−), c306Gal4/+; +/+; UASAip1- RNAi GD/+ (Aip1-RNAi) and c306Gal4/+; gmf1/gmf1; UAS-Aip1-RNAi GD/+ (dGMF −/−, Aip1-RNAi). (H) Aip1 silencing resulted in localization of dGMF at sites of F-actin accumulation, whereas dGMF did not localize to F-actin aggregates induced by over-expression of constitutive active formin Dia. Confocal images of follicular epithelium displaying F-actin accumulation (detected by fluorescent phalloidin). Genotypes are: c306Gal4/+; UAS-Aip1-RNAi kk/+; (Aip1-RNAi) and UAS-Dia-CA /+; +/SlboGal4 (over expression of constitutively active Dia). The site of F-actin and dGMF accumulation in Aip1 silenced epithelium is indicated with yellow arrowhead. Bar, 10 µm. See also Figure S2.

