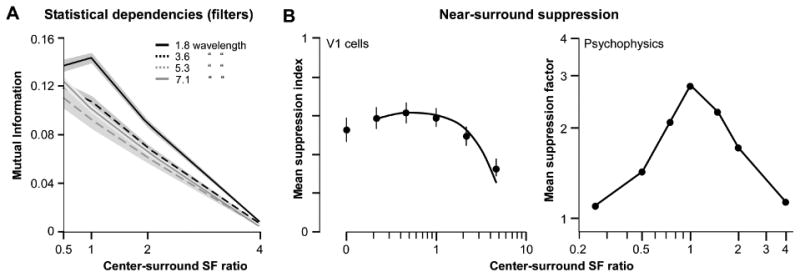
Figure 5. The spatial frequency-tuning of the statistical dependencies between V1-like filters and of surround suppression both depend on spatial separation.

(A) Mutual information between the center and surround filters as a function of their spatial frequency (SF) ratio (SF of the surround filter normalized to the SF of the center filter), measured for different filter separations (indicated by the different curves according to legend). (B) LEFT: Mean suppression index as a function of the SF ratio of center and surround gratings for a population of macaque V1 cells. Center and surround gratings were at the orientation preferred by the cell, and the surround grating mainly stimulated the near surround (6-8° outer diameter). Data are from Webb et al. (2005). RIGHT: Mean suppression factor (ratio of the contrast detection thresholds of the center+surround to the center alone gratings) as a function of the SF ratio of center and surround gratings for 4 human subjects. Surround suppression was measured using a contrast detection task. Data are from Petrov, Carandini, & McKee (2005).
