Figure 6.

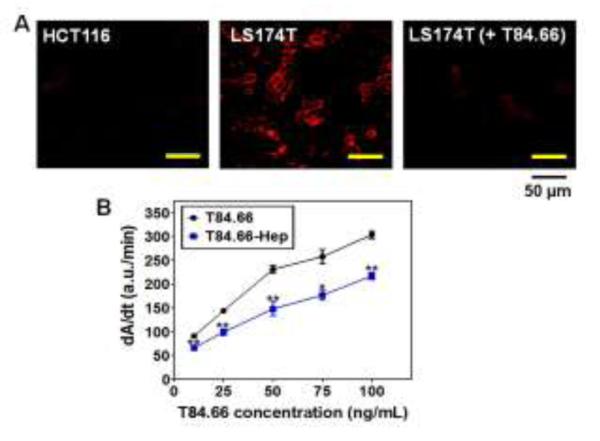
In vitro characterization of T84.66-Hep. (A) Fluorescent microscopic images of HCT116 (CEA low expression cell line; left) and LS174T (high expression cell line; middle) cells treated with TRITC-labeled T84.66-Hep, as well as LS174T cells (right) incubated with TRITC-labeled T84.66-Hep after pre-incubation with 10-fold molar excess of unlabeled T84.66. After incubation, cells were washed with PBS, and then the live cell images were acquired by a Nikon A1R-A1 confocal laser microscope with a 20×objective (Nikon). (B) ELISA results of T84.66 and T84.66-Hep against . 96-well plates were coated with recombinant CEA (rCEA). and after wash, incubated with varied concentrations (0, 25, 50, 75 and 100 μg/mL) of T84.66 and T84.66-Hep. After incubation, the wells were washed and then incubated with goat anti-mouse-IgG (Fc specific)-alkaline phosphatase. After washing, p-nitrophenyl phosphate was added to the wells and the change in absorbance at 405 nm was monitored, and the initial rates (dA/dt) for the antibodies were plotted. The statistical significant differences of the initial rates of T84.66 and those of T84.66-Hep were compared by Student’s t-test. *P < 0.05, **P < 0.01. (T84.66-Hep: T84.66-heparin chemical conjugate)
