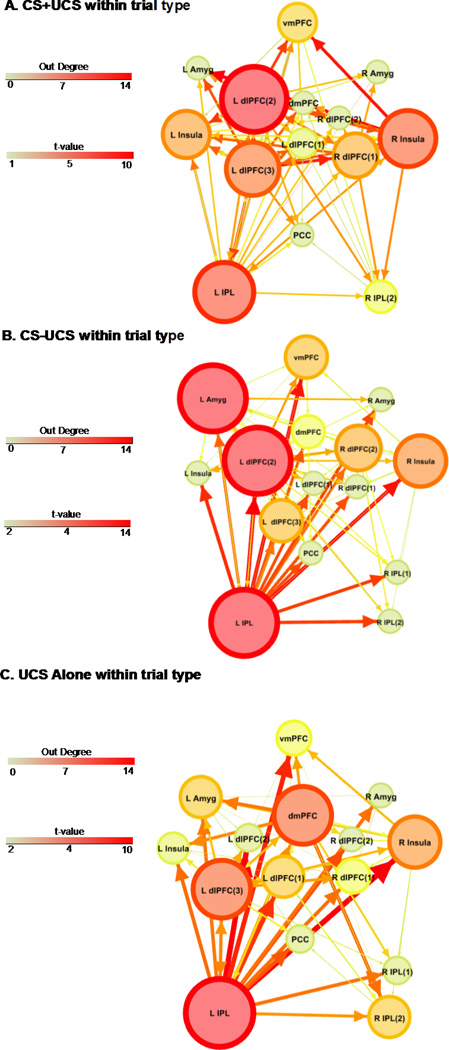
Figure 3.
Differential effective connectivity. Greater connectivity during a predictable UCS (CS+UCS) than during an unpredictable UCS (UCS alone) (A) and greater connectivity during an unpredictable UCS than during a predictable UCS (B). Line size and color reflect the t-value for the two sample t-test. ROI size and color depict ‘out degree’ (i.e. the total number of outward projections from a ROI). Numbers within parentheses reflect distinct ROI within a particular brain region (e.g. dlPFC). Abbreviations: L, left; R, right; dlPFC, dorsolateral prefrontal cortex; dmPFC, dorsomedial prefrontal cortex; vmPFC, ventromedial prefrontal cortex; Amyg, amygdala; IPL, inferior parietal lobule; PCC, posterior cingulate cortex. (2 columns)

