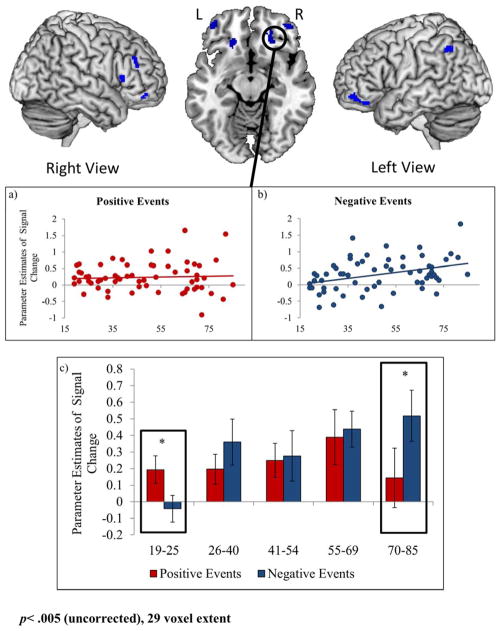
Figure 2.
Regions showing age-related increases in activity during negative relative to positive events (blue regions). Parameter estimates for activity during a) positive and b) negative event retrieval are plotted from a 5mm sphere surrounding the peak voxels from one region of interest: 22, 34, -12 (orbitofrontal cortex). For visualization purposes, parameter estimates are also plotted for 5 age groups that were approximately equivalent in size (2c) and represented a continuous age range. When the difference between negative and positive events is significant, this is noted with an asterisk. Coordinates are presented in MNI space.

