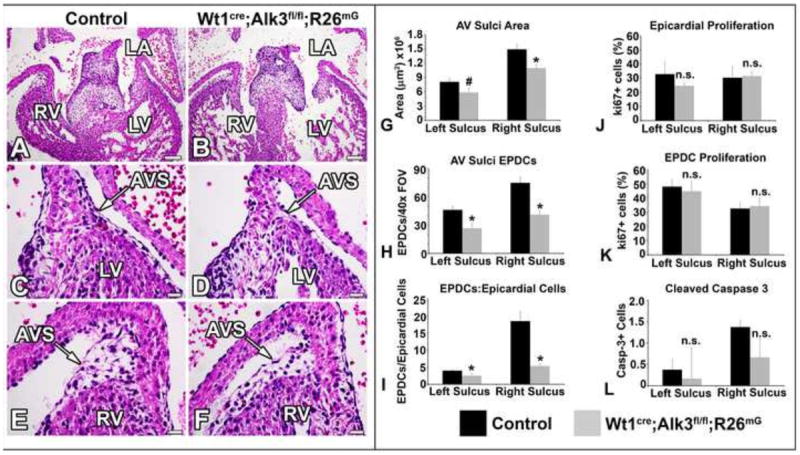
Figure 5. Loss of Alk3 in EPDCs results in hypoplasia of the AV sulcus.

Panels A-F show H/E stained sections of ED13 control (A,C,E) and Wt1cre;Alk3fl/fl;R26mG (B,D,F) hearts. The staining reveals hypoplastic AV sulci in the Wt1cre;Alk3fl/fl;R26mG heart at the left (D) and right (F) AV junctions. (G) Quantification of left and right AV sulcus areas shows a significant reduction in AV sulci size. (H) Hypoplasia of the left and right AV sulcus is due to a significantly decreased number of EPDCs within the tissue. (I) The ratio of AV sulcus EPDCs to AV epicardial cells is significantly reduced in Wt1cre;Alk3fl/fl;R26mG hearts. Despite a significant reduction in the number of AV sulcus EPDCs, the percentage of proliferating (ki67+) AV sulcus EPDCs (J) and overlying AV epicardial cells (K) is not significantly different between control and Wt1cre;Alk3fl/fl;R26mG specimens. (L) Apoptosis of AV EPDCs, marked by Cleaved Caspase 3, is not significantly different in Wt1cre;Alk3fl/fl;R26mG hearts. (Scale bars in A and B=100μm, scale bars in C-F=20μm); n≥3; *=p<0.05, #=p<0.1, n.s.= not statistically significant. AVS, AV sulcus; LA, left atria; LV, left ventricle; RV, right ventricle.
