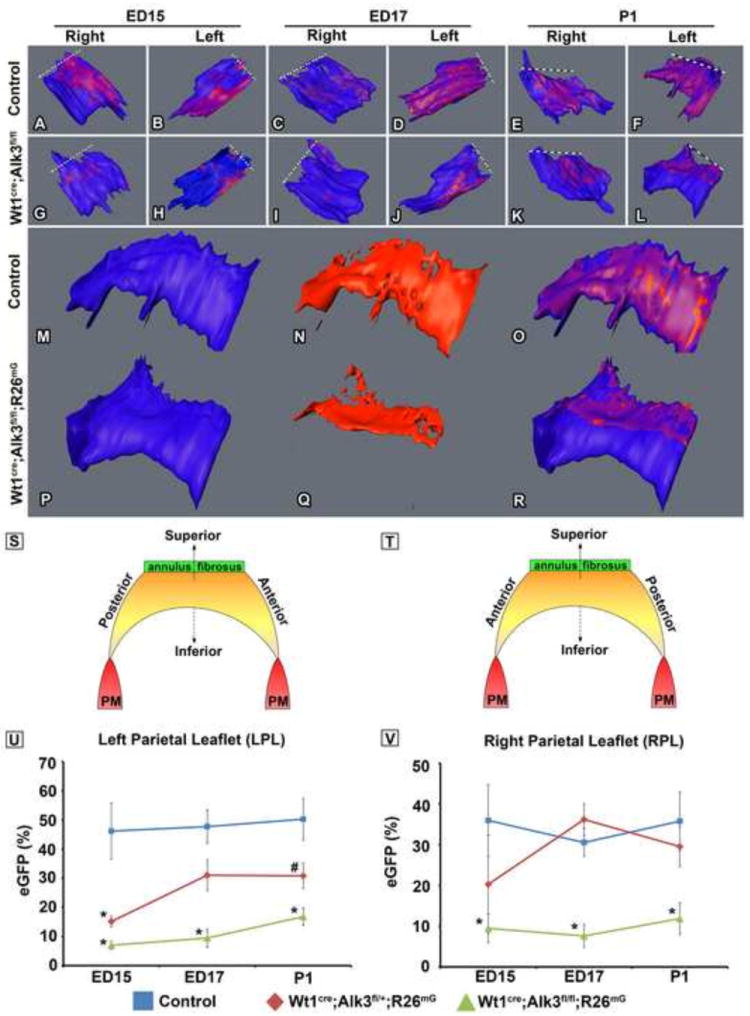
Figure 8. Spatiotemporal Assessment of the distribution of eGFP labeled EPDCs within the parietal leaflets.

Panels A-R show 3D reconstructions of the right parietal leaflets (RPL) and the left parietal leaflets (LPL) from control and Wt1cre;Alk3fl/fl;R26mG specimens staged ED15, ED17, and postnatal day 1 (P1). The dashed lines in panels A-L indicate the location of the distal end of the leaflet where it connects to the annulus fibrosis. Panels M-R depict neonatal LPLs (blue; M,P) and the spatiotemporal contribution of EPDCs (red; N,Q) in control (M-O) and Wt1cre;Alk3fl/fl;R26mG hearts (P-R). Panels S and T are schematically depicting the structure and orientation of the LPL and the RPL as well as the associated anatomic descriptors. In panels U and V the EPDC contribution to the parietal leaflets in control, Wt1cre;Alk3fl/+;R26mG, and Wt1cre;Alk3fl/fl;R26mG specimens at each stage is quatified. The volume of eGFP+ cells was divided by the total volume of the valve. At ED15, ED17, and P1 the percentage of eGFP positive cells within the LPL (U) and RPL (V) is significantly decreased in Wt1cre;Alk3fl/fl;R26mG hearts. n≥3 for ED15 and P1, n≥2 for ED17; *=p<0.05, AL, aortic leaflet; LPL, left parietal leaflet; LV, left ventricle.
