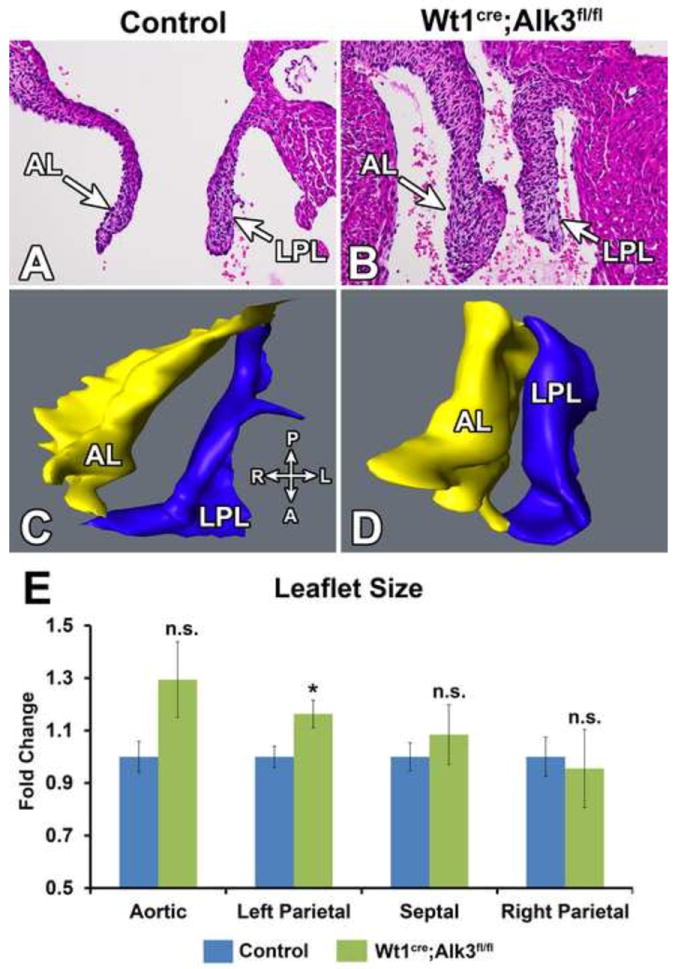
Figure 9. Increased leaflet size in neonatal mitral valves of Wt1cre;Alk3fl/fl;R26mG hearts.

Panels A and B show Hematoxylin and Eosin stained neonatal control (A) and Wt1cre;Alk3fl/fl;R26mG (B) hearts. Panel B demonstrates that the AL and LPL of the mitral valve is enlarged in the Wt1cre;Alk3fl/fl;R26mG heart. Panels C and D show 3D reconstructions of the mitral valves shown in panels A and B. The compass in the lower right of panel C provides the anatomic orientation of the 3D rendering with the posterior (P) and anterior (A) on the vertical axis and right (R) and left (L) on the horizontal axis. Panel E shows the quantification of the valve volume as obtained by 3D AMIRA reconstruction. Valve volume is expressed as fold change over control. The volumes of the LPL in Wt1cre;Alk3fl/fl;R26mG neonatal specimens was significantly larger than that of the controls while the AL, SL and RPL were not significantly different. n≥5; *p=<0.05, A, anterior; AL, aortic leaflet; D, distal: L, left; LPL, left parietal leaflet; P, posterior; R, right; RPL, right parietal leaflet.
