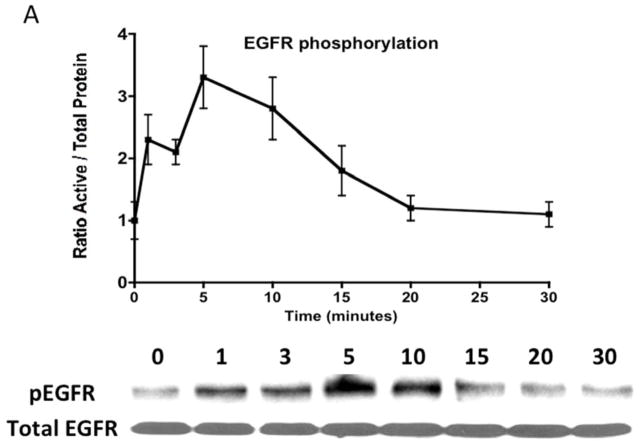
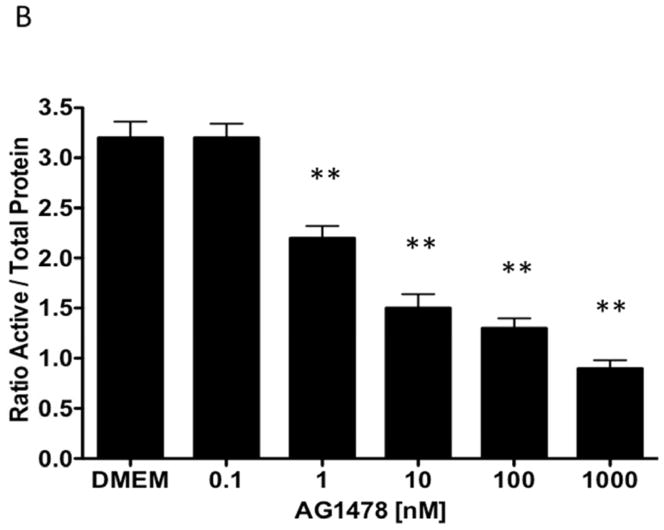
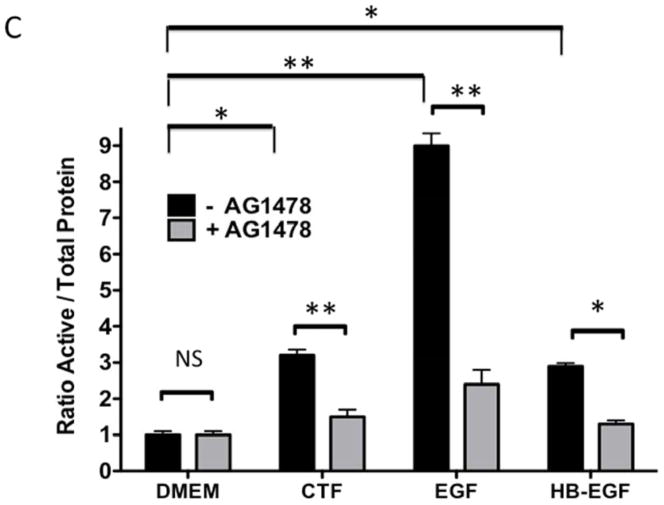
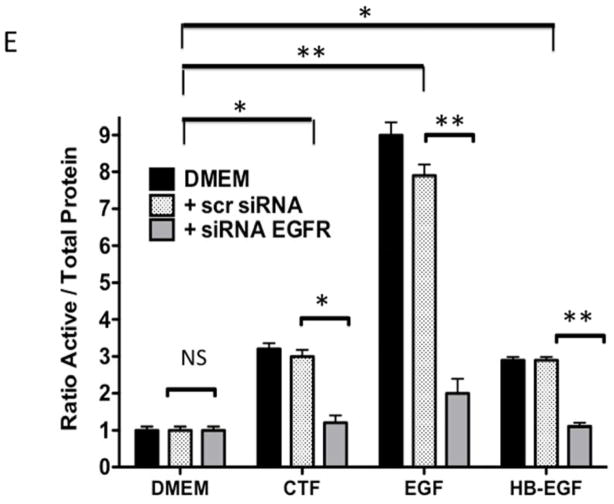
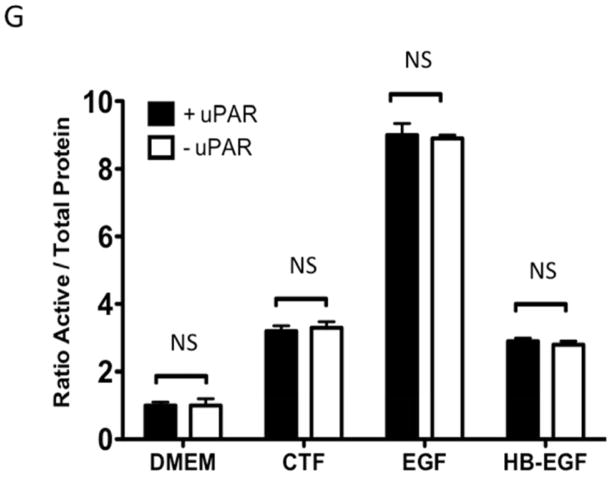
Figure 2. CTF and EGFR activation.
[A] Time-dependent EGFR phosphorylation in response to CTF [10 nM] in cultured human coronary vascular smooth muscle cells. Values are the mean±s.e.m. ratio of active /total EGFR protein for five experiments. Representative western blot is shown.
[B] Inhibition of EGFR phosphorylation by AG1478 in response to CTF [10 nM] occurs in a concentration-dependent manner. Values are the mean±s.e.m. ratio of active /total EGFR protein for five experiments [**p<0.01].
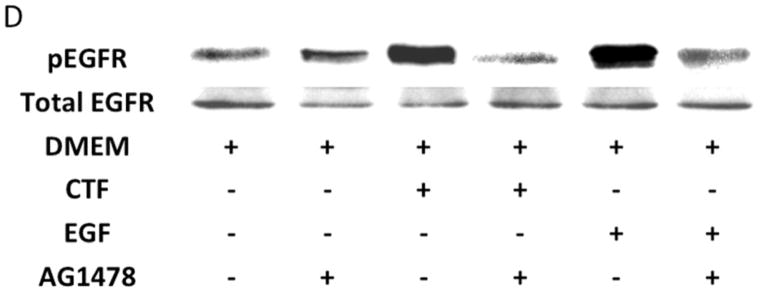
[C] Inhibition of EGFR phosphorylation in response to CTF [10 nM], EGF [10 μg/mL] and HB-EGF [10 μg/mL] in the presence and absence of the EGFR inhibitor [AG1478]. Values are the mean±s.e.m. ratio of active /total EGFR protein for five experiments [*p<0.05; **p<0.01]. Representative western blots are shown in [D].
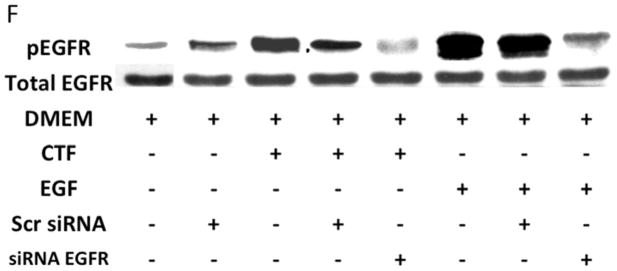
[E] EGFR phosphorylation in response to CTF [10 nM], EGF [10 μg/mL] and HB-EGF [10 μg/mL] in the presence and absence of the siRNA to EGFR. Scr siRNA, scrambled siRNA control. Values are the mean±s.e.m. ratio of active /total EGFR protein for five experiments [*p<0.05; **p<0.01]. Representative western blots for CTF and EGF are shown in [F].
[G] EGFR phosphorylation in response to CTF [10 nM], EGF [10 μg/mL] and HB-EGF [10 μg/mL] in the presence and absence of the uPAR on the cell surface. Values are the mean±s.e.m. ratio of active /total EGFR protein for five experiments.

