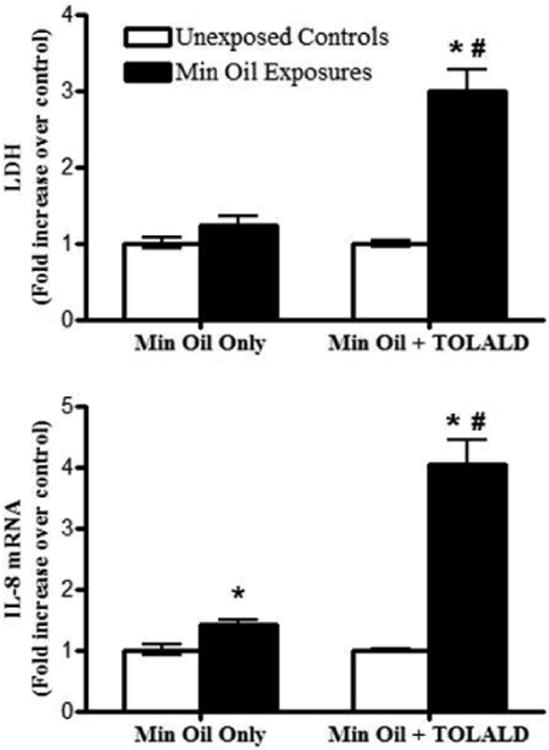
Figure 10.

Fold increase in LDH (measured in basolateral media) and IL8 mRNA levels of exposures to mineral oil only and mineral oil with TOLALD compared to their respective controls. The asterisk symbol (*) indicates a statistically significant difference (t-test; p < 0.05) over unexposed controls. The pound sign (#) indicates a statistically significant difference (t-test; p < 0.05) between the mineral oil only exposure and the mineral oil with TOLALD exposure. Data shown for “Min Oil Only” is the mean of two independent experiments (n=6 for each independent experiment). Data shown for “Min Oil + TOLALD” is from one independent experiment (n=6). Data is presented as the mean ± standard error from the mean.
