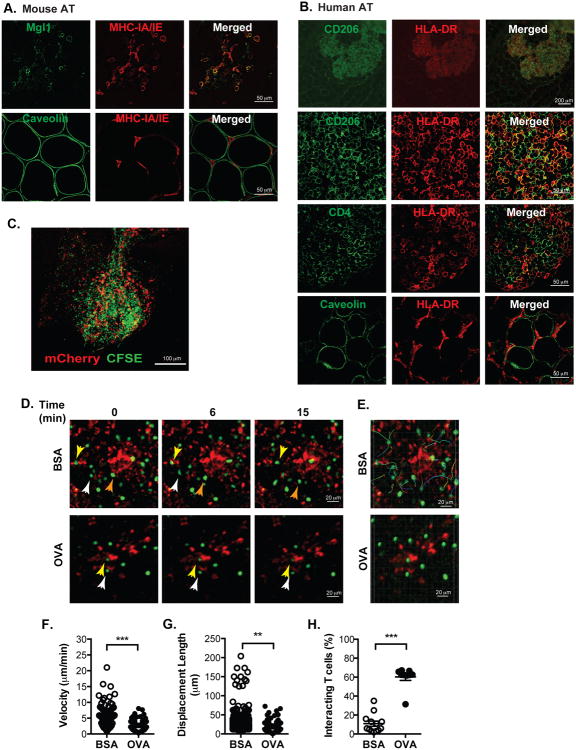
Figure 1. Adipose tissue macrophages (ATMs) physically interact with CD4+ T cells in an antigen-dependent manner.
(A) Immunofluorescence analysis of MHCII+ cells (red) in FALCs (Fat-Associated Lymphoid Clusters) regions of mouse adipose tissue.
(B) Immunofluorescence analysis of HLA-DR+ (red) cells in human omental tissue. Representative images presented from similar results from 5 independent samples.
(C) Maximum intensity projection of z-stacks in FALCs in eWAT from CD11c-mCherry mice adoptively transferred with CFSE-CD4+ cells.
(D) Time-lapse images of interacting CD11c+ ATMs (red) and OTII CD4+ T cells (green) in eWAT from CD11c-mCherry mice injected with BSA (upper) or OVA (lower). Imaging of adipose tissue performed with intravital multi-photon confocal microscopy over a 20 minute imaging window.
(E) CD4+ T cell migration pathways in adipose tissue from mice injected with BSA (upper) or OVA (lower).
(F) Velocity and (G) displacement lengths of individual CD4+ T cells in eWAT.
(H) Percent of CD4+ T cells interacting with CD11c+ cells in eWAT. Microscopy data are representative of three independent experiments.
Data are means ± SEM. ** p < 0.01, *** p <0.001 versus BSA.

