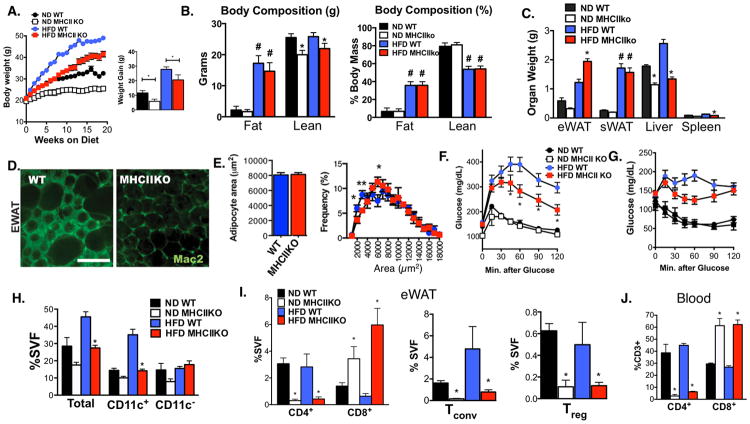
Figure 2. MHCII deficient mice are protected from HFD-induced insulin resistance through the reduction of ATMs and CD4+ ATT accumulation.
MHCIIKO (KO) and WT control male mice were fed ND or HFD for 20 weeks. (A) Body weights of WT and MHCIIKO (KO) mice during ND and HFD feeding (ND: n = 6; HFD: n = 8).
(B) Body composition analysis of fat and lean mass in WT and KO mice as determined by NMR. Right panel shows normalization to total body weight.
(C) Organ weights at the end of the diet exposure.
(D) Immunofluorescence identification of Mac2+ ATMs in eWAT from HFD fed WT and KO mice. Scale bar = 200 μm.
(E) Adipocyte size and adipocyte size distribution in eWAT from HFD fed WT and KO mice.
Analysis of glucose metabolism by (F) GTT and (G) ITT.
(H) Quantitation of Total, CD11c+, and CD11c- ATMs (CD11 b+F480+) in eWAT from WT and KO mice by flow cytometry.
(I) Quantitation of CD3+ CD4+ and CD3+ CD8+ ATTs (left), Tconv and Treg (right) in eWAT in WT and KO mice.
(J) Quantitation of blood CD3+ CD4+ and CD3+ CD8+ T lymphocytes from WT and KO mice.
Data are shown as means ± SEM. # p<0.05 in one-way ANOVA, * p<0.05, ** p <0.01, *** p <0.001 versus WT.

