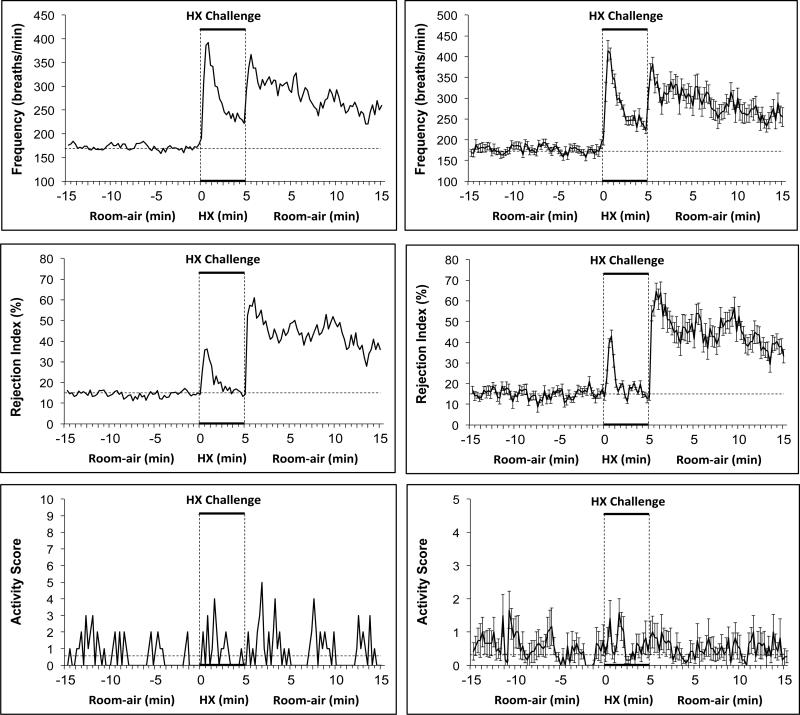
Figure 1.
Typical examples (left-hand panels) and summary graphs (right-hand panels) of frequency of breathing, Rejection Index (0% = no disordered breathing, 100% = completely disordered breathing) and Activity Score (see Methods for details) of conscious C57BL6 mice (n=16) before, during a 5 min challenge with a hypoxic (HX) gas mixture (10% O2, 90% N2), and following return to room-air. The data in the right-hand panels are presented as mean ± SEM.

