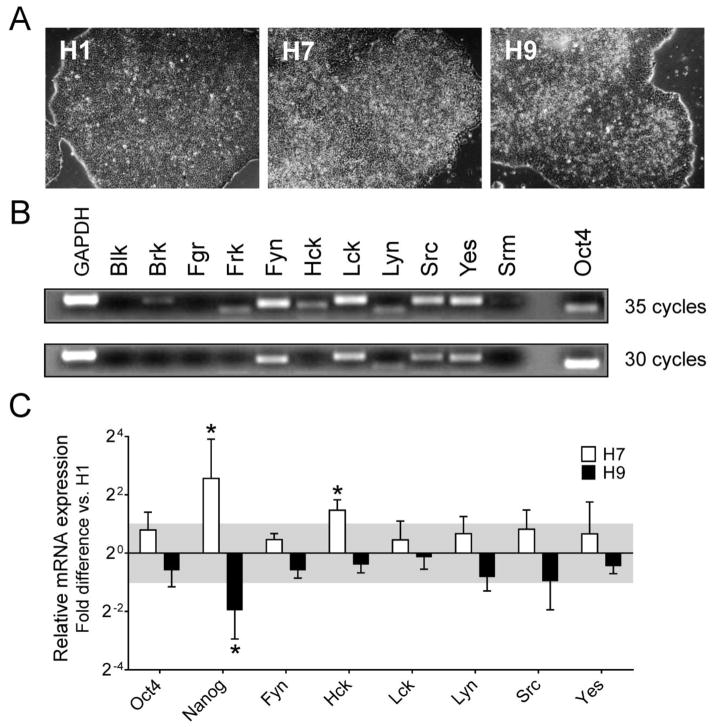
Figure 1. Profile of SFK gene expression in hES cells.
A) The hES cell lines H1, H7 and H9 were maintained under feeder-free conditions on Matrigel-coated plates using mTeSR1 medium. All three lines grew as large domed colonies with well-circumscribed boundaries. B) H1 hES cells were harvested 5 days after passage for RNA isolation. SFK (Blk, Fgr, Fyn, Hck, Lck, Lyn, c-Src, c-Yes), Src-related kinase (Brk, Frk, Srm) and pluripotency marker (Oct4) expression were determined by RT-PCR with GAPDH as a positive control. Images of agarose gels of the PCR products are shown after 30 and 35 PCR cycles. C) Relative SFK (Fyn, Hck, Lck, Lyn, c-Src, c-Yes) and pluripotency marker (Oct4, Nanog) expression levels across three hES cell lines. Transcript levels for the indicated genes were determined by quantitative real-time RT-PCR for the H1, H7 and H9 hES cell lines. The results are expressed as the average fold-change in mRNA level in H7 and H9 cells relative to H1 cells ± SEM (n = 3, *p < 0.05; pairwise xed reallocation randomization test). SFK expression varied by less than 2-fold across these hES cell lines (gray area), with the exception of Hck expression in H7 cells.

