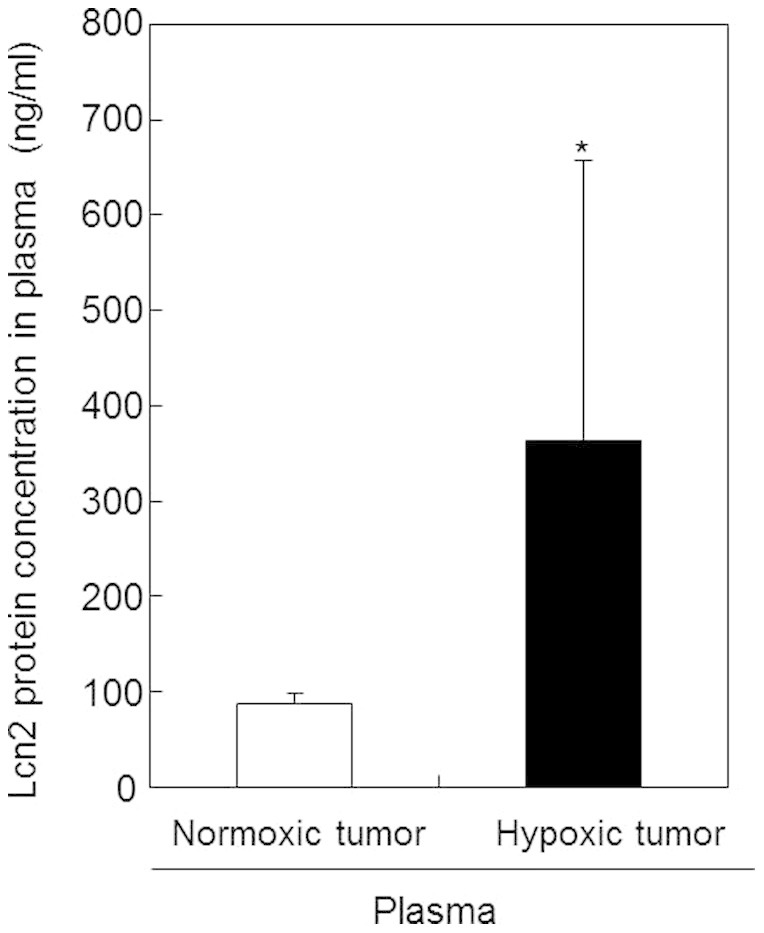
Figure 2. Comparison of Lcn2 protein concentrations in blood plasma samples of normoxic and hypoxic tumors.

Plasma samples were prepared from blood collected from mice bearing normoxic or hypoxic tumors. Lcn2 protein concentrations in plasma samples were measured by ELISA. Values represent the means of 5 individual samples. Bars represent standard deviations. *, p < 0.05 vs. normoxic tumor.
