
Figure 5. LCN2 expression in various human cancer cell lines cultured under hypoxic conditions.
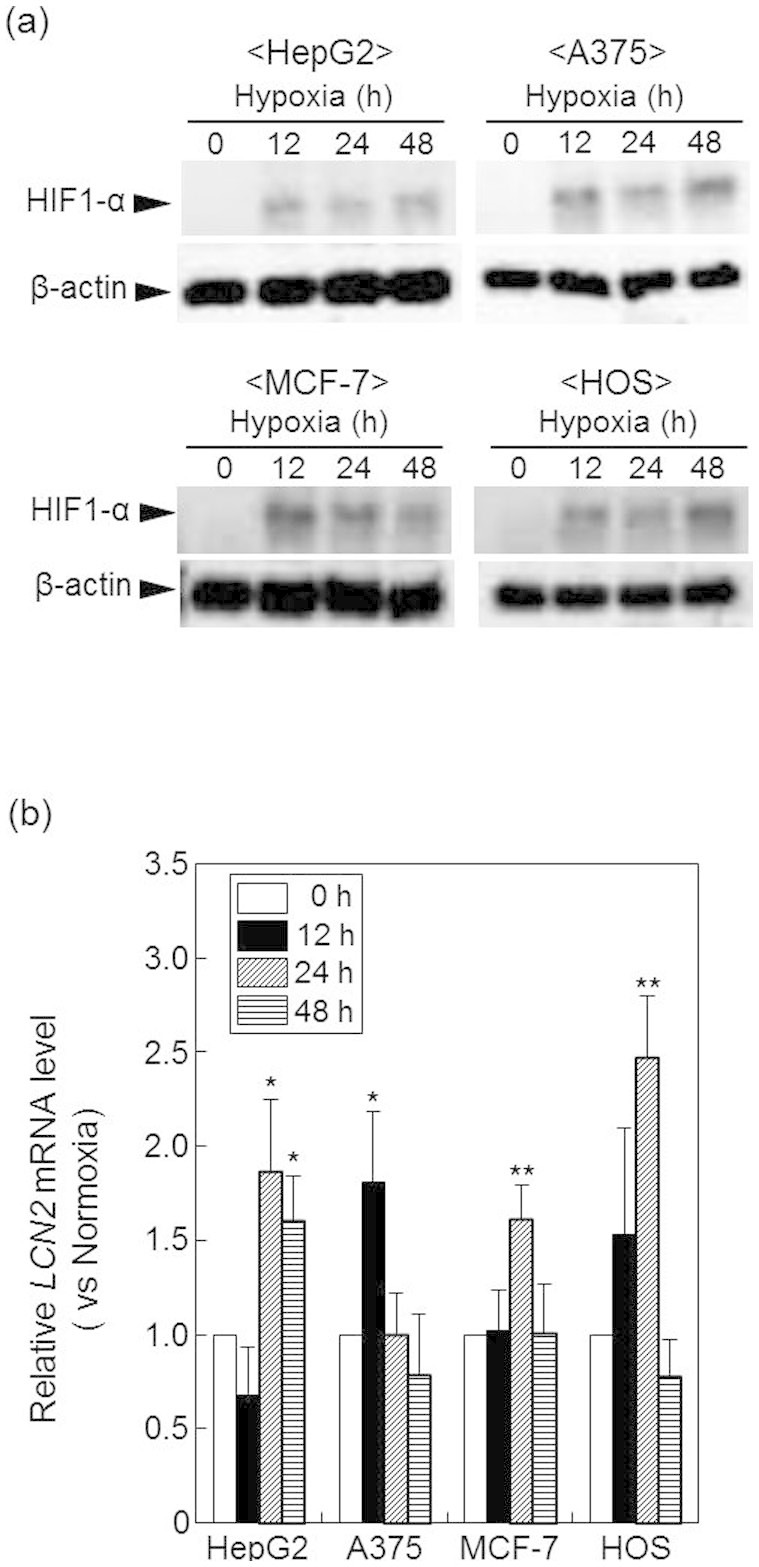
HepG2, A375, MCF-7, and HOS cells were cultured for the indicated times under normoxic or hypoxic conditions. (a) HIF-1α protein levels were determined by western blotting. β-Actin was used as a loading control. Full-length blots/gels are presented in Supplementary Figure 3. (b) RNA was isolated from cells and used to quantify LCN2 mRNA expression by real-time RT-PCR. Data show relative mRNA expression using β-actin mRNA as an internal standard. Values represent the means of 3 individual experiments. Bars represent standard deviations. *P < 0.05 and **P < 0.01 vs. normoxic conditions.