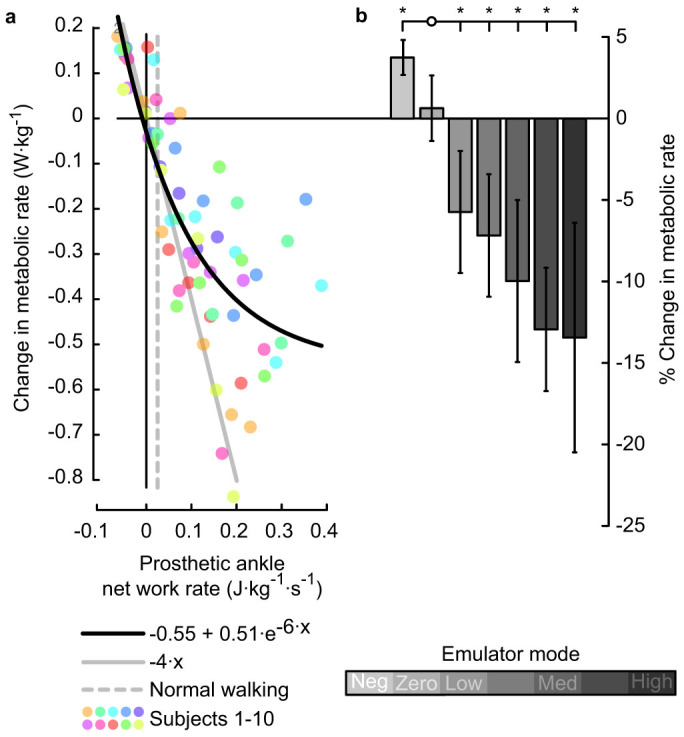
Figure 2. Metabolic rate decreased with increasing ankle push-off work.

(a) Change in metabolic rate versus net prosthetic ankle stride-averaged work rate. Colored dots indicate data from individual subjects. Heavy black line is an exponential fit to the data. Solid gray line provides a reference for the rate of metabolic reduction if prosthesis work replaced muscle fiber work directly at 25% muscle efficiency. Dashed gray line indicates net biological ankle work rate in the Normal Walking condition. (b) Change in metabolic rate averaged across subjects for each condition. Shading indicates condition, error bars indicate inter-subject standard deviation, and *s indicate statistical significance. % change calculated with respect to the net metabolic rate at zero net prosthesis work.
