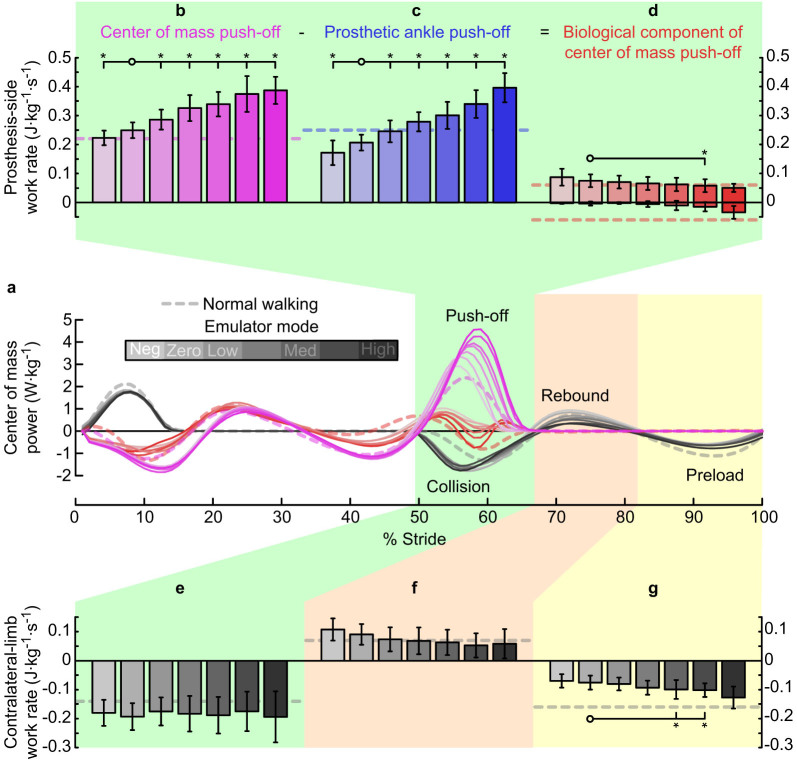
Figure 3. Center of mass power for each limb and center of mass work for key phases of the gait cycle.
(a) Center of mass power versus percent stride. Lines indicate average trajectories for each condition, with darker lines corresponding to increased prosthesis push-off work. Magenta lines are mechanical power of the prosthesis-side limb on the center of mass. Red lines are the biological component of prosthesis-side mechanical power. Gray lines are contralateral-limb power on the center of mass. Top: (b) Prosthesis-side center of mass work rate during push-off, (c) prosthetic ankle joint power during push-off, and (d) the biological component of center of mass work rate during push-off, calculated as b−c. Bottom: Center of mass work rate of the contralateral limb during (e) collision, (f) rebound, and (g) preload phases. Error bars indicate inter-subject standard deviation, *s indicate statistical significance.

