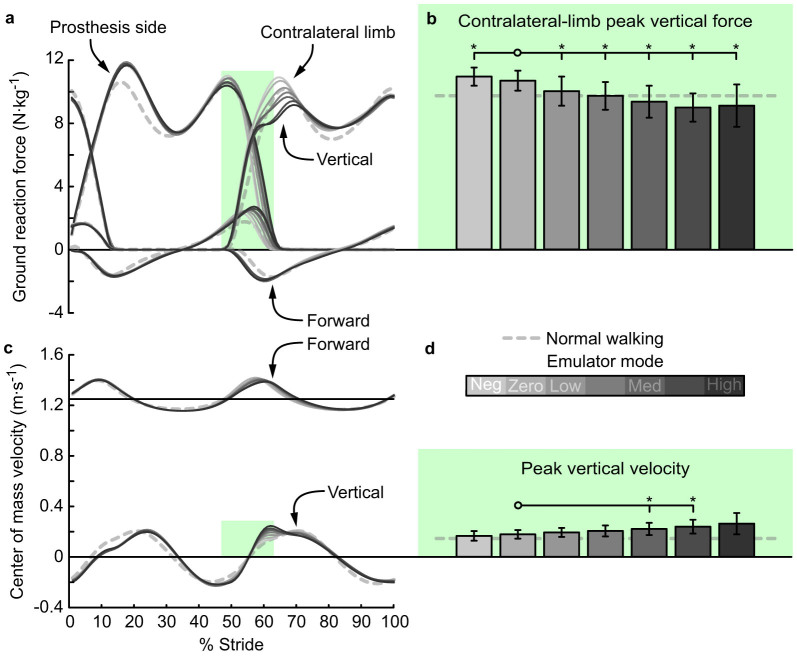
Figure 4. Ground reaction forces and center of mass velocity were affected by increasing ankle push-off work.
(a) Ground reaction forces versus percent stride. Lines indicate average trajectories for each condition, with darker lines corresponding to conditions with higher prosthesis push-off work. (b) Peak ground reaction force on the contralateral limb during the double support period, indicated by green shading, decreased with increased prosthetic ankle push-off work. (c) Center of mass velocity versus percent stride. (d) Peak center of mass velocity during the double support period, indicated by green shading, increased with increased prosthetic ankle push-off work. Error bars indicate inter-subject standard deviation and *s indicate statistical significance.

